INTRA-SPESIFIC DIVERSITY OF BUTTERFLY PEA (Clitoria ternatea L.) REVEALED BY ISSR WITH INVARIABLE ITS RECORDS

Article Highlights:
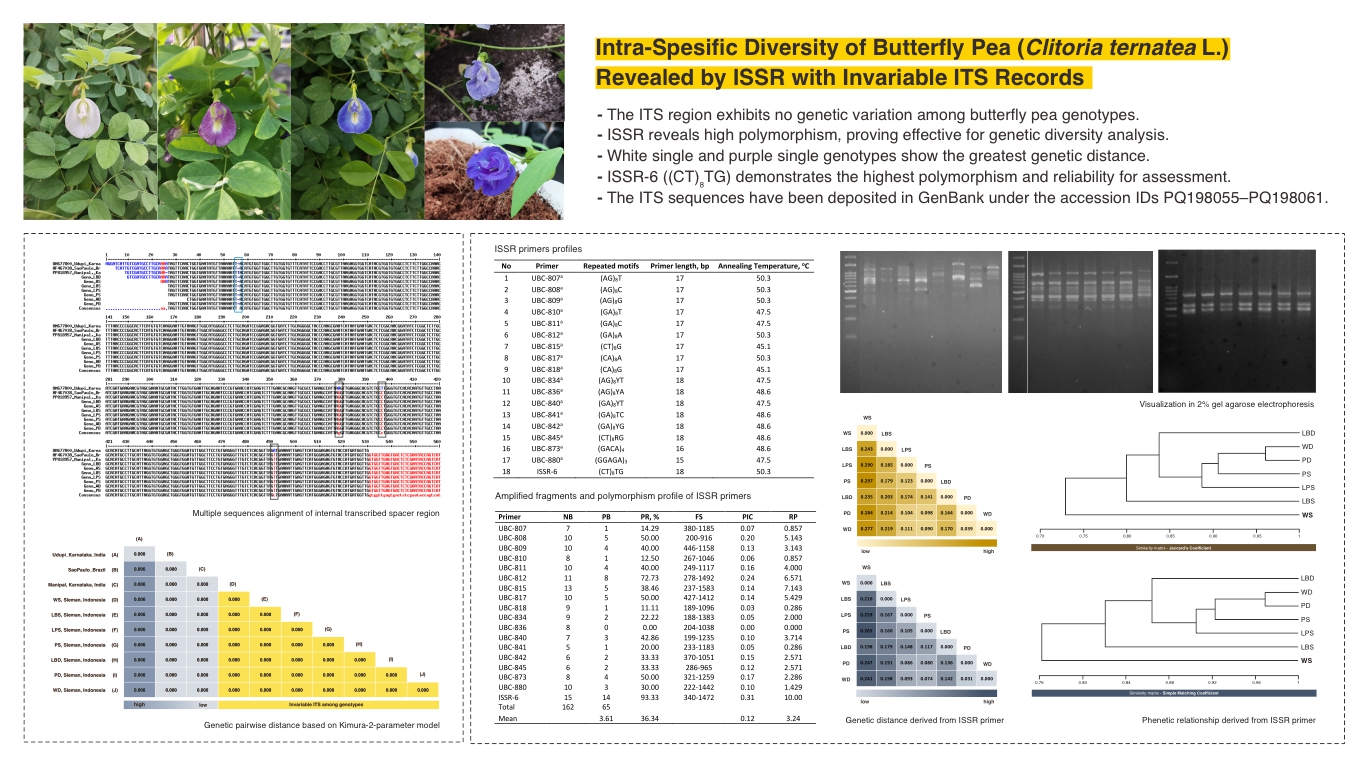
- The ITS region exhibits no genetic variation among butterfly pea genotypes.
- ISSR reveals high polymorphism, proving effective for genetic diversity analysis.
- White single and purple single genotypes show the greatest genetic distance.
- ISSR-6 ((CT)₈TG) demonstrates the highest polymorphism and reliability for assessment.
- The ITS sequences have been deposited in GenBank under the accession IDs PQ198055–PQ198061.
ABSTRACT
Clitoria ternatea L., a perennial plant in the Fabaceae, is recognized for its resilience in tropical climates and its diverse applications in both culinary and medicinal fields. However, the limited exploration of its genetic diversity constrains breeding efforts aimed at improving desirable traits. This limitation highlights the need to optimize selection strategies, identify superior genotypes, and preserve valuable genetic resources for long-term conservation and crop enhancement. This study aimed to explore genetic variation using molecular markers to analyze C. ternatea genotypes based on petal architecture and color differences. To assess the genetic diversity of C. ternatea, Sanger sequencing of the Internal Transcribed Spacer (ITS) region and Inter-Simple Sequence Repeat (ISSR) markers were applied to seven wild populations from Sleman, Yogyakarta. The ITS region exhibited no genetic variation, indicating its conserved nature and limited ability to differentiate genotypes. In contrast, ISSR markers effectively detected genetic variation, identifying 62 polymorphic fragments out of 162 total bands. The highest genetic distance (0.297) was observed between the WS and PS genotypes, whereas the double-petal genotypes (WD and PD) displayed the closest phenetic relationship. Among the ISSR primers, UBC-808, UBC-812, and ISSR-6 exhibited high PIC and RP values, confirming their reliability in genetic diversity analysis. These results underscore the utility of ISSR markers as a robust tool for genetic diversity assessment, offering valuable insights for breeding programs and germplasm conservation in C. ternatea.
INTRODUCTION
Clitoria ternatea L. is a perennial plant from the Fabaceae, thrives in tropical climates and demonstrates resilience to environmental disturbances. It is widely recognized for its traditional Ayurvedic medicine and culinary applications (Ashraf et al., 2023); (Maneechot et al., 2023). The flowers are used as supplements to enhance cognitive function (Oguis et al., 2019)and serve as a natural food coloring in rice cakes, tea, and various desserts (Chusak et al., 2018).
Additionally, flower extracts have been reported to exhibit antibacterial, antioxidant, and antidiabetic properties (Rajamanickam et al., 2015); (Jeyaraj et al., 2022).
Morphologically, C. ternatea flowers are solitary, grow in the axils, and have a characteristic papilionaceous structure. This species exhibits notable variations in petal morphology, with flowers having either single or double layers of petals. In the single-layer type, the flower follows a papilionaceous structure, consisting of a standard petal (the largest), two wing petals, and two keel petals. In contrast, the double-layer type is characterized by enlarged wing and keel petals that reach the size of the standard petal, creating a layered appearance. The colors were distinct, ranging from white to blue and purple, corresponding to differences in anthocyanin composition ((Suarna & Wijaya, 2021); (Surya et al., 2022)).
Genetic variation plays a vital role in shaping species’ traits and their capacity to adapt to changes in the environment (Mora et al., 2005). Molecular data-based identification techniques are particularly effective in describing species because they rely on stable genetic markers that are not influenced by environmental factors ((Loureiro & Malfeito-Ferreira, 2006); (Elufioye & Badal, 2017)). A frequently used marker in genetic research is the Internal Transcribed Spacer (ITS) region, which is located between the 16S, 5.8S, and 26S regions of rDNA (Froeschke & Von Der Heyden 2014). Several studies have demonstrated the success of using ITS regions for assessing plant genetic diversity at the inter- and intraspecific levels ((Tripathi et al., 2013); (Sokołowska et al., 2022); (Pere et al., 2023)). ITS1 is generally more variable than ITS2 due to the presence of variable repeat units, making it particularly useful for species discrimination and effective in distinguishing various species in Fabaceae ((Nolan & Cribb, 2005); (Vilas et al., 2005); (, 2010)).
DNA-based molecular markers are other ideal tools for evaluating genetic diversity, breeding- related traits, and other mobile segments due to their neutrality and practicality (Bishoyi et al., 2014)(Hasan et al., 2021)(Aliabadi et al., 2023)(Nidianti et al., 2023)(Rosyidi et al., 2023). Inter Simple Sequence Repeats (ISSR) are a molecular marker technique that utilizes microsatellite sequences as primers to amplify regions between tandem repeats. ISSR markers are widely used due to their reliability, cost-effectiveness, rapid application, and high sensitivity in genetic analysis ((McGlaughlin et al., 2002); (Sarwat, 2012); (Rahali et al., 2022)), and has been widely used to identify intraspecific variation ( (Zebarjadi et al., 2016); (Nilkanta et al., 2017); (Verma et al., 2017); (Abdelaziz et al., 2020); (Yusuf & Daryono, 2021); (Devi et al., 2024); (Ahmed et al., 2022-12-23)). ISSR cover a broad portion of the genome, include numerous polymorphic loci, and do not necessitate prior genomic knowledge (Liu et al., 2015); (Tiwari et al., 2016).
Given the considerable variability in petal color and structural traits among C. ternatea genotypes, this study has been implemented to identify genetic variations and expand the knowledge base for breeding programs. Documenting this diversity is crucial for preserving genetic material that may otherwise be lost through breeding and cultivation, as well as for ensuring the continuity of information regarding species richness and existence.
MATERIALS AND METHODS
Genomic DNA Extraction
Seven distinct variants of C. ternatea were collected from a wild population in Sleman, Indonesia, each exhibiting different petal architecture and colors differences. Genomic DNA was extracted from 100 mg of frozen leaf samples with the Genomic DNA Mini Kit Plant (Geneaid, Taiwan). The concentration and purity of the DNA were evaluated using a NanoDrop Lite Plus spectrophotometer (Thermo Fisher Scientific, USA), with acceptable purity from 1.8 to 2.0 (Green & Sambrook, 2012).
Amplification Process
PCR amplification was performed using the MyTaq HS RedMix (Bioline, US) protocol with several modifications. The total reaction volume was 20 µL, comprising 10 µL of MyTaq HS RedMix, 2 µL of primer, 2 µL of DNA sample at 50 ng/µL, and 6 µL of nuclease-free water. The amplification process was conducted in a T100 Thermal Cycler (Bio-Rad, US) over 40 cycles. The total reaction volume was 20 µL, consisting of 10 µL of MyTaq HS RedMix, 2 µL of primer, 2 µL of DNA sample (50 ng/µL), and 6 µL of nuclease-free water. Amplification was performed using a T100 Thermal Cycler (Bio-Rad, US) with 40 cycles. Each cycle involved a 45-second denaturation step at 95 °C, a 30-second annealing step at 45 - 50 °C, and a 1-minute elongation step at 72 °C. The protocol began with an initial denaturation at 95 °C for 3 minutes and ended with a final extension at 72 °C for 5 minutes. A universal ITS primer pair was employed, comprising ITS-u1 (5’-GGAAGKARAAGTCGTAACAAGG-3’) and ITS-u4 (5’-RGTTTCTTTTCCTCCGCTTA-3’)(Cheng et al., 2016). Details of the eighteen ISSR primers used are provided in Table 1.
| No | Primer | Repeated motifs |
Primer length, bp |
Annealing Temperature, oC |
|---|---|---|---|---|
| 1 | UBC-807a | (AG)8T |
17 |
50.3 |
| 2 | UBC-808a | (AG)8C |
17 |
50.3 |
| 3 | UBC-809a | (AG)8G |
17 |
50.3 |
| 4 | UBC-810a | (GA)8T |
17 |
47.5 |
| 5 | UBC-811a | (GA)8C |
17 |
47.5 |
| 6 | UBC-812a | (GA)8A |
17 |
50.3 |
| 7 | UBC-815a | (CT)8G |
17 |
45.1 |
| 8 | UBC-817a | (CA)8A |
17 |
50.3 |
| 9 | UBC-818a | (CA)8G |
17 |
45.1 |
| 10 | UBC-834a | (AG) 8 YT |
18 |
47.5 |
| 11 | UBC-836a | (AG) 8 YA |
18 |
48.6 |
| 12 | UBC-840a | (GA) 8 YT |
18 |
47.5 |
| 13 | UBC-841a | (GA) 8 TC |
18 |
48.6 |
| 14 | UBC-842a | (GA) 8 YG |
18 |
48.6 |
| 15 | UBC-845a | (CT) 8 RG |
18 |
48.6 |
| 16 | UBC-873a | (GACA) 4 |
16 |
48.6 |
| 17 | UBC-880a | (GGAGA) 3 |
15 |
47.5 |
| 18 | ISSR-6 | (CT) 8 TG |
18 |
50.3 |
Agarose Gel Electrophoresis
The PCR products were separated by horizontal agarose gel electrophoresis on a 2% agarose gel (1st BASE, Singapore) stained with FloroSafe DNA stain (1st BASE, Singapore). Electrophoresis was carried out in 2% TBE buffer at 50 volts for 60 minutes. A 100 bp DNA ladder (Geneaid, Taiwan) was run simultaneously to estimate the molecular weights of the amplified products. The stained gels were subsequently visualized and documented with a GelDoc-UV transilluminator.
Sanger Sequencing and Bioinformatic Analysis
Sanger sequencing was analyzed at LPPT UGM, and the contig sequences were edited using GeneStudio v.2.2.0.0 (GeneStudio, Inc.). The cleaned sequences were subsequently analyzed using a BLAST search against the NCBI database. OPAL, integrated with MESQUITE (version 3.61), was used to align the contig sequences and accession sequence data retrieved from GenBank. Genetic distances were determined using MEGA-X (Tripathi et al., 2013), and multiple sequence alignments were visualized with the MultAlin web- based software.
Binary Data Analysis
ISSR are dominant markers that provide bi- state (presence-absence) assessments (Shiran et al., 2007); (Bishoyi et al., 2014). The recorded gels were scored for the absence (0) and presence (1) of bands, without considering band intensity, since each band occurrence with a specific molecular weight represents a locus (Ali et al., 2013). Band interpretation was performed using CorelDRAW software to define the operational taxonomical unit (OTU). The formula D = 1 − F, where F is the species similarity matrix value, was used to compute genetic distance (D) (Hillis et al. 1996) . The Multi- Variate Statistical Package (MVSP) program was then used to create phenetic dendrograms based on the similarity matrix.
RESULTS AND DISCUSSION
Petals Observation
The flowers of C. ternatea exhibit a range of morphological variations, including petal architecture and colors differences ( (Bishoyi et al., 2014); (Suarna & Wijaya, 2021)). Based on petal arrangement, we identified two different types: single and double petalloid (Figure 1). In terms of color, there were four variations: white, light blue, light purple, and purple (Figure 1). Petal colors have been recorded in several studies (Yeotkar et al., 2011); (Ali et al., 2013); (Bishoyi et al., 2014). Chemically, petal color corresponds to its phytochemical composition, particularly anthocyanins (Jeyaraj et al., 2022), with no correlation to kaempferol content (Ali et al., 2013). Variations in anthocyanin concentration may influence the intensity of purple pigmentation, creating a color gradient ranging from white and blue to deep purple.
Invariable ITS Records
One of the most often utilized genetic markers in plant phylogenetics and DNA barcoding is the ITS region of nuclear ribosomal DNA ((Poczai & Hyvönen, 2010); (Cheng et al., 2016)). Due to its high sequence-level variability, conserved flanking regions, and quick coordinated evolution under comparable functional constraints, this region is helpful for resolving connections within genera and below species level ((J et al., 2002); (Poczai & Hyvönen, 2010); (Zhao et al., 2018)).
The ITS sequences obtained from seven genotypes of C. ternatea were aligned to identify the types of mutations present. The alignment revealed two types of mutations: insertions/ deletions (indels) and substitutions. An indel was observed at 56th nucleotide position (Figure 2), where an additional nucleotide base T was present in the sample from Manipal, Karnataka, India, whereas the other samples exhibited a deletion at this position. Regarding substitution mutations, three specific changes were identified: A/G378, T/C396, and A/T491, which distinguished the sample from Udupi, Karnataka, India from the others (Figure 2 & Figure 3).
Figure 1.Variations in flower petal of butterfly pea observed in this study
Figure 2.Multiple sequences alignment of internal transcribed spacer of butterfly pea
Figure 3.Genetic pairwise distance based on Kimura-2-parameter model
These findings suggested a degree of genetic variation among the analyzed genotypes, particularly in samples from Karnataka, India, which exhibited both indels and substitutions that differentiate them from other populations. The presence of an additional T nucleotide in the Manipal sample and the three substitution mutations in the Udupi sample indicated localized genetic divergence, possibly due to geographic isolation, environmental adaptation, or selective pressures.
Conversely, the identical ITS sequences observed in the seven genotypes and the São Paulo, Brazil samples suggested a high level of genetic conservation in this region, implying a shared evolutionary lineage or limited genetic differentiation over time. This could be due to recent common ancestry, low mutation rates in the ITS region, or historical seed exchange and cultivation practices that maintain genetic uniformity.
Moreover, ITS sequence data for C. ternatea remains highly limited in GenBank, restricting comprehensive comparative analyses. Nevertheless, an alignment-based analysis of all available ITS sequences, despite reducing the overall sequence length, revealed no genetic distance among the examined accessions (data not shown). This further reinforces the hypothesis that the ITS region in C. ternatea is highly conserved across different populations. Further phylogenetic studies incorporating additional molecular markers and broader geographic sampling would be necessary to better understand the genetic diversity and evolutionary history of this species. The sequence data from this study has been submitted to GenBank and assigned accession numbers PQ198055–PQ198061 for WS, LBS, LPS, PS, LBD, PD, and WD, respectively.
The universal ITS primer (ITS-u1/ITS-u4) employed in this study amplifies the ITS1-ITS2, and is suitable for over 95% of plants groups (Cheng et al., 2016). Numerous studies have already proven the efficiency of ITS in explaining phylogenetic connections and revealing interspecific genetic diversity within the Fabaceae ((Ainouche & Bayer, 1999); (J et al., 2002); (, 2010); (Wu et al., 2013); (Xu et al., 2017)).
In terms of their application in elucidating intraspecific relationships, ITS regions can reveal sufficient sequence divergence to assess genetic diversity in Korean native Lilium ((Sultana et al., 2011)), while ITS2 has been reported to show significantly higher intraspecific divergence in discriminating Chinese Zanthoxylum species (Zhao et al., 2018).
Nevertheless, some research findings indicated that ITS markers exhibit low intraspecific genetic diversity. This is exemplified by the Thar Desert endemic population of Commiphora wightii (Haque et al., 2009), as well as populations of Aquilaria malaccensis and Aquilaria hirta in Peninsular Malaysia, where no intraspecific variation was detected (Lee et al., 2018). Therefore, ITS markers are not linked to genes encoding morphological traits, further reinforcing the lack of correlation between morphological and genetic variation found in this study. The absence of ITS polymorphism among C. ternatea genotypes suggested a high level of sequence conservation, indicating that other genetic regions, such as functional genes or regulatory elements, may be responsible for the observed morphological differences. We overcame this obstacle by using ISSR molecular markers, which are essential for evaluating genetic stability in diverse breeding lines and for describing genetic variation both within and between species ((Porth & El-Kassaby, 2014); (Aristya et al., 2019); (Hasan et al., 2021); (Yusuf et al., 2023)).
Assessment of Polymorphism by ISSR
With an average of nine fragments generated from each of the eighteen ISSR primers, a total of 162 fragments with sizes ranging from 188 bp to 1583 bp were obtained (Table 2). A total of 62 polymorphic fragments were found among them, with an average of 3.61 polymorphic fragments for each primer. Each primer has a different number of polymorphic bands, ranging from 1 to 14. Specifically, the primer UBC-836 displayed eight monomorphic bands and no polymorphic bands, indicating a 0% polymorphism rate (Table 2). ISSR-6 had the largest polymorphism information content (PIC) value, measuring 93.33%, and a resolving power (RP) value of 10.00. This demonstrates the primer’s usefulness in genetic variation research and its capacity to identify C. ternatea genotypes. The 18 ISSR primers produced an RP value of 3.23 and a PIC value of 0.12 on average.
The effectiveness of ISSR depends on the compatibility of each primer sequence with the target genome. The bands produced reflect the presence of specific microsatellites in the genome and guide the amplification process to generate inter-microsatellite regions. It is highly probable that different amplified bands can be produced using the same ISSR primer sequences. For instance, similar ISSR primers studied by (Vijayan & Chatterjee, 2003) in mulberry produced fewer scored bands compared to our study in C. ternatea, though both were lower than in Mucuna pruriens (Devi et al., 2024). This is consistent with the low amplification results produced by UBC-807, UBC- 808, UBC-841, UBC-842, UBC-873, and UBC-880 in our study. The percentage of polymorphism is also influenced by the sample size, which correlates with the extent of the analyzed gene pool. Such variations were also observed in many Fabaceae species during ISSR-based analyses ((F et al., 2016); (, 2020); (Ojuederie et al., 2020); (Qahtan, 2021); (Reddy et al., 2022); (Aliabadi et al., 2023); (Helal et al., 2023)).
Identification based on ISSR markers in different populations of C. ternatea produced Jaccard’s coefficient similarity index from 0.80 to 0.98 (Bishoyi et al., 2014). In our study, the use of the informative primer ISSR-16 enhanced the ability to identify genetic variation among C. ternatea genotypes. Three identical repeated primer sequences—(AG)8C, (AG)8G, and (CT)8G—were observed in this study, Bishoyi et al. (2014), and Nurhasanah et al. (2023). The observed results for the repeated motifs (CT)8G and (AG)8C by Bishoyi et al. (2014) were closely related to our study in terms of polymorphism rate, resolving power, and PIC values. The PIC value of (AG) 8 C, around 0.20, was also similar to Nurhasanah et al. (2023). For the motif (AG) 8 G, we identified a higher polymorphism rate and PIC value, although the RP value was lower than Bishoyi et al. (2014) and Nurhasanah et al. (2023). Another method for analyzing genetic variation is the use of Simple Sequence Repeats (SSR), which can provide allelic information among genotypes (Gebhardt, 2007). SSR analysis has clearly validated the existence of allelic differences between blue and white flower color genotypes, based on the markers CcM2763 and CcM0830 (Naik et al., 2020).
Primer |
NB |
PB |
PR (%) |
FS |
PIC |
RP |
|---|---|---|---|---|---|---|
UBC-807 |
7 |
1 |
14.29 |
380-1185 |
0.07 |
0.857 |
UBC-808 |
10 |
5 |
50.00 |
200-916 |
0.20 |
5.143 |
UBC-809 |
10 |
4 |
40.00 |
446-1158 |
0.13 |
3.143 |
UBC-810 |
8 |
1 |
12.50 |
267-1046 |
0.06 |
0.857 |
UBC-811 |
10 |
4 |
40.00 |
249-1117 |
0.16 |
4.000 |
UBC-812 |
11 |
8 |
72.73 |
278-1492 |
0.24 |
6.571 |
UBC-815 |
13 |
5 |
38.46 |
237-1583 |
0.14 |
7.143 |
UBC-817 |
10 |
5 |
50.00 |
427-1412 |
0.14 |
5.429 |
UBC-818 |
9 |
1 |
11.11 |
189-1096 |
0.03 |
0.286 |
UBC-834 |
9 |
2 |
22.22 |
188-1383 |
0.05 |
2.000 |
UBC-836 |
8 |
0 |
0.00 |
204-1038 |
0.00 |
0.000 |
UBC-840 |
7 |
3 |
42.86 |
199-1235 |
0.10 |
3.714 |
UBC-841 |
5 |
1 |
20.00 |
233-1183 | 0.05 |
0.286 |
UBC-842 |
6 |
2 |
33.33 |
370-1051 |
0.15 |
2.571 |
UBC-845 |
6 |
2 |
33.33 |
286-965 |
0.12 |
2.571 |
UBC-873 |
8 | 4 |
50.00 |
321-1259 | 0.17 |
2.286 |
UBC-880 |
10 |
3 |
30.00 |
222-1442 | 0.10 |
1.429 |
ISSR-6 |
15 |
14 |
93.33 |
340-1472 | 0.31 | 10.00 |
| Total | 162 | 65 |
||||
| Mean | 3.61 |
36.34 |
0.12 | 3.24 |
||
Figure 4.Phenetic dendrogram of seven genotype of butterfly pea based on (A) Jaccard’s and (B) simple matching coefficient
Figure 5.Figure 5 Genetic distance of seven genotype of butterfly pea based on (A) Jaccard’s and (B) simple matching coefficient
The dendrogram plots constructed from 18 ISSR primers did not reveal specific clades, instead showing random plotting due to the very low genetic variance among C. ternatea genotypes. Two methods for measuring similarity, Jaccard’s (SJ) and simple matching (SSM) coefficients, produced similar results (Figure 4).
The red line in Figure 4, indicates the lowest similarity percentage among the white single genotype compared to the other genotypes, with 73% and 76% similarity according to SJ and SSM, respectively. A higher similarity percentage, ≥ 80%, was observed among genotypes marked with a blue line in Figure 4. The highest similarity percentage among C. ternatea genotypes was between the white double and purple double genotypes, with similarity values of 96% and 97% for SJ and SSM, respectively.
According to Jaccard’s coefficient, the greatest genetic distance was observed between the white single (WS) and purple single (PS) genotypes, with a value of 0.297 (Figure 5A). This was followed by genetic distances between white single (WS) and the light purple single (LPS), purple double (PD), white double (WD), and light blue single (LBS) genotypes, with values of 0.290, 0.284, 0.277, and 0.243, respectively. A similar trend was observed when using the Simple Matching Coefficient, though the dissimilarity values were generally lower compared to those derived from Jaccard’s method (Figure 5B).
ISSR markers are dominant and arbitrary, amplifying random regions of the genome without targeting specific genes responsible for morphological traits. As a result, the genetic variation detected does not necessarily correspond to the observed morphological differences. This lack of correlation suggests that while phenotypic variation in C. ternatea may be influenced by genetic factors, it is likely regulated by specific loci that are not captured by ISSR markers. Additionally, environmental factors and epigenetic modifications could contribute to the observed morphological diversity, further decoupling it from the genetic profiles revealed in this study.
CONCLUSION
ITS sequencing revealed no genetic variation, as all 7 genotypes in this study exhibited identical sequences with no detected indels or substitutions, confirming the conserved nature of this region and its inefficacy in assessing genetic diversity. ISSR markers demonstrated high efficacy, identifying 62 polymorphic fragments out of 162 total bands, indicating substantial genetic variation within the population. The greatest genetic distance (0.297) was observed between the white single and purple single genotypes. The double-petal genotypes (WD and PD) exhibited the closest phenetic relationship. Among the ISSR primers tested, ISSR-6 exhibited the highest polymorphism (93.33%) and resolving power (10.00), further reinforcing its reliability for genetic diversity assessment. No direct correlation was observed between ISSR polymorphism and petal morphology. The detected genetic diversity provides essential baseline data for C. ternatea germplasm conservation, ensuring the preservation of diverse genetic resources with potential applications in future breeding programs. ISSR markers offer a valuable tool for genetic diversity analysis, and their integration with advanced molecular approaches, such as SNP genotyping or gene expression analysis, can further enhance the identification of genetic loci associated with petal color and structure.
References
- Abdelaziz M.S., Medraoui L., Alami M., Pakhrou O., Makkaoui M., Ould Mohamed Salem Boukhary A., Filali-Maltouf A.. Inter simple sequence repeat markers to assess genetic diversity of the desert date (Balanites aegyptiaca Del.) for Sahelian ecosystem restoration. Sci Rep. 2020; 10(1)DOI
- Ahmed A.S., Barznjy L.G.K., Kasnazany S.A.S., Mohammed D.O.. Genetic diversity study of melon native landraces using ISSR markers in Kurdistan Region of Iraq. J Agric Ecol Res Int. 2022; 23(6):213-7. DOI
- Ainouche A., Bayer R.J.. Phylogenetic relationships in Lupinus (Fabaceae: Papilionoideae) based on internal transcribed spacer sequences (ITS) of nuclear ribosomal DNA. Am J Bot. 1999; 86(4):590-607. DOI
- Aliabadi F., Bagheri A., Abbasi S., Saeidi H., Blattner F.R.. High genetic diversity in an endemic and vulnerable species: Evidence from Astragalus cyclophyllon (Fabaceae) in Iran. Genet Resour Crop Evol. 2023; 70(7):1999-2008. DOI
- Ali Z., Ganie S.H., Narula A., Sharma M.P., Srivastava P.S.. Intra-specific genetic diversity and chemical profiling of different accessions of Clitoria ternatea L. Ind Crop Prod. 2013; 43:768-73. DOI
- Aristya G.R., Kasiamdari R., Arif M.F., Amalia F., Pawestri R.D.. Comparison of molecular markers ISSR, SSR and RFLP to study the genetic variation of strawberry cultivars. Am J Agric Biol Sci. 2019; 14(1):61-8. DOI
- Ashraf K., Adlin N.F., Basri A.N., Ahmad W., Sultan S.. The traditional uses, phytochemistry, and pharmacological effects of Clitoria ternatea: A review. Ind J Pharm Edu Res. 2023; 58(1):1-14. DOI
- ISSR-PCR approach as a means of studying genetic variation in moth bean (Vigna aconitifolia (Jacq.) Maréchal. Biocatal Agric Biotechnol. 2020; 30(101827)DOI
- Bishoyi A.K., Pillai Geetha, KA Maiti, S.. Assessment of genetic diversity in Clitoria ternatea populations from different parts of India by RAPD and ISSR markers. Genet Resour Crop Evol. 2014; 61(8):1597-1609. DOI
- Cheng T., Xu C., Lei L., Li C., Zhang Y., Zhou S.. Barcoding the kingdom Plantae: New PCR primers for ITS regions of plants with improved universality and specificity. Mol Ecol Resour. 2016; 16(1):138-49. DOI
- Chusak C., Henry C.J., Chantarasinlapin P., Techasukthavorn V., Adisakwattana S.. Influence of Clitoria ternatea flower extract on the in-vitro enzymatic digestibility of starch and its application in bread. Foods. 2018; 7(7)DOI
- Devi N.S., Rajwanshi R., Mohapatra K.P.. Evaluating the genetic variability in selected accessions of medicinal legume Mucuna pruriens (L) DC through ISSR markers. Ecol Genet Genom. 2024; 32(100262)DOI
- F Dos Santos Araújo, M Vasconcelos Pacheco, Almeida Vieira FC Dos Santos Ferrari, F Cardoso Félix, KP Teixeira Das Chagas. ISSR molecular markers for the study of the genetic diversity of Mimosa caesalpiniaefolia Benth. Idesia. 2016; 34(3):1040670718-34292016000300007.
- Elufioye T.O., Badal S.. Elsevier: Amsterdam (NL; 2017. DOI
- Froeschke G., Heyden S.. A review of molecular approaches for investigating patterns of coevolution in marine host–parasite relationships. Advances in Parasitology. 2014; apter 4:209-52. DOI
- Identification of medicinal plants in the family Fabaceae using a potential DNA barcode ITS2. J Ethnopharmacol. 2010; 130(1):116-21. DOI
- Gebhardt C.. Elsevier: Oxford (UK; 2007. DOI
- Green M.R., Sambrook J.. Cold Spring Harbor Laboratory Press: New York (US; 2012.
- Haque I., Bandopadhyay R., Mukhopadhyay K.. Intraspecific variation in Commiphora wightii populations based on Internal Transcribed Spacer (ITS1-5.8S-ITS2) sequences of rDNA. Diversity. 2009; 1(2):89-101. DOI
- Hasan N., Choudhary S., Naaz N., Sharma N., Laskar R.A.. Recent advancements in molecular marker-assisted selection and applications in plant breeding programmes. J Genet Eng Biotechnol. 2021; 19(1)DOI
- Helal H., Sayed A.E.H., Helal A., El Shaer H.. Genetical studies on some genotypes in chickpea (Cicer arietinum L.) by Gamma Rays and ISSR Marker. Al-Azhar J Agric Res. 2023; 48(3):475-92. DOI
- Jeyaraj E.J., Lim Y.Y., Choo W.S.. Antioxidant, cytotoxic, and antibacterial activities of Clitoria ternatea flower extracts and anthocyanin-rich fraction. Sci Rep. 2022; 12(1)DOI
- Lee S.Y., Mohamed R., Faridah-Hanum I., Lamasudin D.U.. Utilization of the internal transcribed spacer (ITS) DNA sequence to trace the geographical sources of Aquilaria malaccensis Lam. populations. Plant Genet Resour. 2018; 16(2):103-11. DOI
- Liu C., Xue G.P., Cheng B., Wang X., He J., Liu G.H., Yang W.J.. Genetic diversity analysis of Capparis spinosa L. populations by using ISSR markers. Genet Mol Res. 2015; 14(4):16476-83. DOI
- Loureiro V., Malfeito-Ferreira M.. Elsevier: Oxford (UK; 2006. DOI
- Maneechot O., Hahor W., Thongprajukaew K., Nuntapong N., Bubaka S.. A natural blue colorant from butterfly pea (Clitoria ternatea) petals for traditional rice cooking. J Food Sci Technol. 2023; 60(8):2255-64. DOI
- McGlaughlin M., Karoly K., Kaye T.. Genetic variation and its relationship to population size in reintroduced populations of pink sand verbena, Abronia umbellata subsp. breviflora (Nyctaginaceae. Conserv Genet. 2002; 3(4):411-20. DOI
- Mora F., Palma-Rojas C., Jara-Seguel P.. Comparison of karyotype of Eucalyptus globulus and Eucalyptus cladocalyx (Myrtaceae)]. Agric Téc 65(1):20-25. 2005. DOI
- Naik A., Mishra S.K., Nag A., Soren G.K., Panda A.K., Panda S.K., Panigrahi J.. Cross-genera amplification of Cajanus spp. specific SSR markers in Clitoria ternatea (L.) and their application in genetic diversity studies. Physiol Mol Biol Plants. 2020; 26(12):2371-90. DOI
- Nidianti E., Subiastuti A.S., Yusuf A.F., Wibowo W.A., Ramadhani P.H., Daryono B.S.. Biological response and molecular identification of the Begomovirus infection in the new Indonesian melon genotype Kinaya. Pak J Phytopathol. 2023; 35(2):223-34. DOI
- Nilkanta H., Amom T., Tikendra L., Rahaman H., Nongdam P.. ISSR marker based population genetic study of Melocanna baccifera (Roxb.) Kurz: A commercially important bamboo of Manipur, North-East India. Scientifica. 2017; 2017:1-9. DOI
- Nolan M.J., Cribb T.H.. Elsevier: Oxford (UK; 2005. DOI
- Nurhasanah Hindersah R., T Suganda, V Concibido, Sundari Karuniawan A.. The first report on the application of ISSR markers in genetic variance detection among butterfly pea (Clitoria ternatea L.) accession in North Maluku Province, Indonesia. Horticulturae. 2023; 9(9)DOI
- Oguis G.K., Gilding E.K., Jackson M.A., Craik D.J.. Butterfly pea (Clitoria ternatea), a cyclotide-bearing plant with applications in agriculture and medicine. Front Plant Sci. 2019; 10(645)DOI
- Ojuederie O.B., Nkang N.A., Odesola K.A., Igwe D.O.. Genetic diversity assessment of winged bean (Psophorcarpus tetragonolobus) accessions revealed by Inter-Simple Sequence Repeat (ISSR) markers. J Plant Biol Crop Res. 2020; 3(1)
- Pere K., Mburu K., Muge E.K., Wagacha J.M., Nyaboga E.N.. Molecular discrimination and phylogenetic relationships of Physalis species based on ITS2 and rbcL DNA barcode sequence. Crops. 2023; 3(4):302-19. DOI
- Poczai P., Hyvönen J.. Nuclear ribosomal spacer regions in plant phylogenetics: Problems and prospects. Mol Biol Rep. 2010; 37(4):1897-1912. DOI
- Porth I., El-Kassaby Y.. Assessment of the genetic diversity in forest tree populations using molecular markers. Diversity. 2014; 6(2):283-295. DOI
- Qahtan A.A.. Genetic diversity and structure analysis of a worldwide collection of Faba bean (Vicia faba) genotypes using ISSR markers. IJAB. 2021; 25(03):683-91. DOI
- Rahali N., Yangui I., Boussaid M., Messaoud C.. Assessment of genetic diversity and population structure of the endemic Hertia cheirifolia (L.) Kuntze based on ISSR and SRAP molecular markers. Biologia. 2022; 77(12):3429-39. DOI
- Rajamanickam M., Kalaivanan P., Sivagnanam I.. Evaluation of anti-oxidant and anti-diabetic activity of flower extract of Clitoria ternatea L. J App Pharm Sci. 2015; 5(8):131-8. DOI
- Reddy P., Sabara P., Padhiyar S.M., Kulkarni G.U., Kheni J.V., Tomar R.S.. Genetic diversity of groundnut (Arachis hypogaea L.) revealed by RAPD and ISSR markers. Annals of Arid Zone. 2022; 60(3):109-15.
- Rosyidi I.N., Yusuf A.F., Sahroni M., Daryono B.S.. Detection of transposon gene in lurik peanuts (Arachis hypogaea var. lurik L.) with AhMITEs analysis. Int J Adv Sci Eng Inf Technol. 2023; 13(4):1349-54. DOI
- Sarwat M.. Humana Press: Totowa (US; 2012. DOI
- Shiran B., Amirbakhtiar N., Kiani S., Sh Mohammadi, Sayed-Tabatabaei B.E., Moradi H.. Molecular characterization and genetic relationship among almond cultivars assessed by RAPD and SSR markers. Sci Hortic. 2007; 111(3):280-92. DOI
- Sokołowska J., Fuchs H., Celiński K.. Assessment of ITS2 region relevance for taxa discrimination and phylogenetic inference among Pinaceae. Plants. 2022; 11(8)DOI
- Suarna I.W., Wijaya I.M.S.. Butterfly pea (Clitoria ternatea L.: Fabaceae) and its morphological variations in Bali. J Trop Biodiv Biotechnol. 2021; 6(2)DOI
- Sultana S., Lim Y.P., Bang J.-W., Choi H.-W.. Internal transcribed spacer (ITS) and genetic variations in Lilium native to Korea. Hortic Environ Biotechnol. 2011; 52(5):502-10. DOI
- Surya D., Rajamani K., Uma D.. Morphological characterization and assessment of anthocyanin in three different genotypes of Clitoria ternatea L. Pharma Innovation Journal. 2022; 11(7):2388-92.
- Tiwari G., Singh R., Singh N., Choudhury D.R., Paliwal R., Kumar A., Gupta V.. 2016. DOI
- Tripathi A.M., Tyagi A., Kumar A., Singh A., Singh S., Chaudhary L.B., Roy S.. PLoS ONE 8(2):e57934. 2013. DOI
- J Vander Stappen, Laet JS Gama-López, Campenhout SG Volckaert. Phylogenetic analysis of Stylosanthes (Fabaceae) based on the internal transcribed spacer region (ITS) of nuclear ribosomal DNA. Plant Syst Evol. 2002; 234(1):27-51. DOI
- Verma K.S., Ul Haq S., Kachhwaha S., Kothari S.L.. RAPD and ISSR marker assessment of genetic diversity in Citrullus colocynthis (L.) Schrad: A unique source of germplasm highly adapted to drought and high-temperature stress. 3 Biotech 7(5):288. 2017. DOI
- Vijayan K., Chatterjee S.N.. ISSR profiling of Indian cultivars of mulberry (Morus spp.) and its relevance to breeding programs. Euphytica. 2003; 131(1):53-63. DOI
- Vilas R., Criscione C.D., Blouin M.S.. A comparison between mitochondrial DNA and the ribosomal internal transcribed regions in prospecting for cryptic species of platyhelminth parasites. Parasitology. 2005; 131(06)DOI
- Wu C.-T., Hsieh C.-C., Lin W.-C., Tang C.-Y., Yang C.-H., Huang Y.-C., Ko Y.-J.. Internal transcribed spacer sequence-based identification and phylogenic relationship of I-Tiao-Gung originating from Flemingia and Glycine (Leguminosae) in Taiwan. J Food Drug Anal. 2013; 21(4):356-62. DOI
- Xu B., Zeng X.-M., Gao X.-F., Jin D.-P., Zhang L.-B.. ITS non-concerted evolution and rampant hybridization in the legume genus Lespedeza (Fabaceae. Sci Rep. 2017; 7(1)DOI
- Yeotkar S.D., Malode S.N., Waghmare V.N., Thakre P.. Genetic relationship and diversity analysis of Clitoria ternatea variants and Clitoria biflora using random amplified polymorphic DNA (RAPD) markers. Afr J Biotechnol. 2011; 10(79):18065-70. DOI
- Yusuf A.F., Alfiyani A., Salsabila T.A.S., Kusnanda P.S., Hidayati I.N., Daryono B.S.. Assessment of maturity stage and stability of new Indonesian melon cultivar ‘Melona’ based on ISSR markers and morphological characteristics. Biodiversitas. 2023; 24(1)DOI
- Yusuf A.F., Daryono B.S.. Studies of genetic and morphological characteristics of Indonesian melon (Cucumis melo L. ‘Hikapel’) germplasm. Int J Adv Sci Eng Inf Technol. 2021; 11(5):2023-30. DOI
- Zebarjadi A., Ahmadvandi H.R., Kahrizi D., Cheghamirza K.. Assessment of genetic diversity by application of Inter Simple Sequence Repeat (ISSR) primers on Iranian Harmal (Peganum harmala L.) germplasm as an important medicinal plant. J Appl Biotechnol Rep. 2016; 3(3):441-45.
- Zhao L., Feng S., Tian J., Wei A., Yang T.. Internal transcribed spacer 2 ( ITS 2) barcodes: A useful tool for identifying Chinese Zanthoxylum. Appl Plant Sci. 2018; 6(6)DOI
Abdelaziz MS, Medraoui L, Alami M, Pakhrou O, Makkaoui M, Ould Mohamed Salem Boukhary A, Filali-Maltouf A. 2020. Inter simple sequence repeat markers to assess genetic diversity of the desert date (Balanites aegyptiaca Del.) for Sahelian ecosystem restoration. Sci Rep 10(1):14948. DOI: 10.1038/s41598-020-71835-9 DOI: https://doi.org/10.1038/s41598-020-71835-9
Ahmed AS, Barznjy LGK, Kasnazany SAS, Mohammed DO. 2022 Dec 23. Genetic diversity study of melon native landraces using ISSR markers in Kurdistan Region of Iraq. J Agric Ecol Res Int 23(6):213-7. DOI: 10.9734/jaeri/2022/v23i6512 DOI: https://doi.org/10.9734/jaeri/2022/v23i6512
Ainouche A, Bayer RJ. 1999. Phylogenetic relationships in Lupinus (Fabaceae: Papilionoideae) based on internal transcribed spacer sequences (ITS) of nuclear ribosomal DNA. Am J Bot 86(4):590-607. DOI: 10.2307/2656820 DOI: https://doi.org/10.2307/2656820
Aliabadi F, Bagheri A, Abbasi S, Saeidi H, Blattner FR. 2023. High genetic diversity in an endemic and vulnerable species: Evidence from Astragalus cyclophyllon (Fabaceae) in Iran. Genet Resour Crop Evol 70(7):1999-2008. DOI: 10.1007/s10722-023-01550-7 DOI: https://doi.org/10.1007/s10722-023-01550-7
Ali Z, Ganie SH, Narula A, Sharma MP, Srivastava PS. 2013. Intra-specific genetic diversity and chemical profiling of different accessions of Clitoria ternatea L. Ind Crop Prod 43:768-73. DOI: 10.1016/j.indcrop.2012.07.070 DOI: https://doi.org/10.1016/j.indcrop.2012.07.070
Aristya GR, Kasiamdari R, Arif MF, Amalia F, Pawestri RD. 2019. Comparison of molecular markers ISSR, SSR and RFLP to study the genetic variation of strawberry cultivars. Am J Agric Biol Sci 14(1):61-8. DOI: 10.3844/ajabssp.2019.61.68 DOI: https://doi.org/10.3844/ajabssp.2019.61.68
Ashraf K, Adlin NF, Basri AN, Ahmad W, Sultan S. 2023. The traditional uses, phytochemistry, and pharmacological effects of Clitoria ternatea: A review. Ind J Pharm Edu Res 58(1):1-14. DOI: 10.5530/ijper.58.1.1 DOI: https://doi.org/10.5530/ijper.58.1.1
Bhadkaria A, Gupta N, Narvekar DT, Bhadkariya R, Saral A, Srivastava N, …, Bhagyawant SS. 2020. ISSR-PCR approach as a means of studying genetic variation in moth bean (Vigna aconitifolia (Jacq.) Maréchal). Biocatal Agric Biotechnol 30:101827. DOI: 10.1016/j.bcab.2020.101827 DOI: https://doi.org/10.1016/j.bcab.2020.101827
Bishoyi AK, Pillai VV, Geetha KA, Maiti S. 2014. Assessment of genetic diversity in Clitoria ternatea populations from different parts of India by RAPD and ISSR markers. Genet Resour Crop Evol 61(8):1597-1609. DOI: 10.1007/s10722-014-0145-y DOI: https://doi.org/10.1007/s10722-014-0145-y
Cheng T, Xu C, Lei L, Li C, Zhang Y, Zhou S. 2016. Barcoding the kingdom Plantae: New PCR primers for ITS regions of plants with improved universality and specificity. Mol Ecol Resour 16(1):138-49. DOI: 10.1111/1755-0998.12438 DOI: https://doi.org/10.1111/1755-0998.12438
Chusak C, Henry CJ, Chantarasinlapin P, Techasukthavorn V, Adisakwattana S. 2018. Influence of Clitoria ternatea flower extract on the in-vitro enzymatic digestibility of starch and its application in bread. Foods 7(7):102. DOI: 10.3390/foods7070102 DOI: https://doi.org/10.3390/foods7070102
Devi NS, Rajwanshi R, Mohapatra KP. 2024. Evaluating the genetic variability in selected accessions of medicinal legume Mucuna pruriens (L) DC through ISSR markers. Ecol Genet Genom 32:100262. DOI: 10.1016/j.egg.2024.100262 DOI: https://doi.org/10.1016/j.egg.2024.100262
Dos Santos Araújo F, Vasconcelos Pacheco M, De Almeida Vieira F, Dos Santos Ferrari C, Cardoso Félix F, Teixeira Das Chagas KP. 2016. ISSR molecular markers for the study of the genetic diversity of Mimosa caesalpiniaefolia Benth. Idesia 34(3):47-52. DOI: 10.4067/S0718-34292016000300007 DOI: https://doi.org/10.4067/S0718-34292016000300007
Elufioye TO, Badal S. 2017. Background to pharmacognosy. In: Badal S, Delgoda R (Editors). Pharmacognosy: Fundamentals, Applications, and Strategies. Amsterdam (NL): Elsevier. p. 3-13. DOI: 10.1016/B978-0-12-802104-0.00001-9 DOI: https://doi.org/10.1016/B978-0-12-802104-0.00001-9
Froeschke G, Von Der Heyden S. 2014. A review of molecular approaches for investigating patterns of coevolution in marine host–parasite relationships. In: Rollinson D (Editor). Advances in Parasitology. 1st Edition. Vol. 84. Chapter 4. Oxford (UK): Elsevier. p. 209-52. DOI: 10.1016/B978-0-12-800099-1.00004-1 DOI: https://doi.org/10.1016/B978-0-12-800099-1.00004-1
Gao T, Yao H, Song J, Liu C, Zhu Y, Ma X, …, Chen S. 2010. Identification of medicinal plants in the family Fabaceae using a potential DNA barcode ITS2. J Ethnopharmacol 130(1):116-21. DOI: 10.1016/j.jep.2010.04.026 DOI: https://doi.org/10.1016/j.jep.2010.04.026
Gebhardt C. 2007. Molecular markers, maps and population genetics. In: Vreugdenhil D, Bradshaw J, Gebhardt C, Govers F, Mackerron DKL, Taylor MA, Ross H (Editors). Potato Biology and Biotechnology: Advances and Perspectives. Oxford (UK): Elsevier. p. 77–89. DOI: 10.1016/B978-044451018-1/50047-6 DOI: https://doi.org/10.1016/B978-044451018-1/50047-6
Green MR, Sambrook J. 2012. Molecular cloning: A laboratory manual. Vol. 1. 4th Edition. New York (US): Cold Spring Harbor Laboratory Press.
Haque I, Bandopadhyay R, Mukhopadhyay K. 2009. Intraspecific variation in Commiphora wightii populations based on Internal Transcribed Spacer (ITS1-5.8S-ITS2) sequences of rDNA. Diversity 1(2):89-101. DOI: 10.3390/d1020089 DOI: https://doi.org/10.3390/d1020089
Hasan N, Choudhary S, Naaz N, Sharma N, Laskar RA. 2021. Recent advancements in molecular marker-assisted selection and applications in plant breeding programmes. J Genet Eng Biotechnol 19(1): 128. DOI: 10.1186/s43141-021-00231-1 DOI: https://doi.org/10.1186/s43141-021-00231-1
Helal H, Sayed AEH, Helal A, El Shaer H. 2023. Genetical studies on some genotypes in chickpea (Cicer arietinum L.) by Gamma Rays and ISSR Marker. Al-Azhar J Agric Res 48(3):475-92. DOI: 10.21608/ajar.2024.227841.1215 DOI: https://doi.org/10.21608/ajar.2024.227841.1215
Jeyaraj EJ, Lim YY, Choo WS. 2022. Antioxidant, cytotoxic, and antibacterial activities of Clitoria ternatea flower extracts and anthocyanin-rich fraction. Sci Rep 12(1):14890. DOI: 10.1038/s41598-022-19146-z DOI: https://doi.org/10.1038/s41598-022-19146-z
Lee SY, Mohamed R, Faridah-Hanum I, Lamasudin DU. 2018. Utilization of the internal transcribed spacer (ITS) DNA sequence to trace the geographical sources of Aquilaria malaccensis Lam. populations. Plant Genet Resour 16(2):103-11. DOI: 10.1017/S1479262117000016 DOI: https://doi.org/10.1017/S1479262117000016
Liu C, Xue GP, Cheng B, Wang X, He J, Liu GH, Yang WJ. 2015. Genetic diversity analysis of Capparis spinosa L. populations by using ISSR markers. Genet Mol Res 14(4):16476-83. DOI: 10.4238/2015.December.9.19 DOI: https://doi.org/10.4238/2015.December.9.19
Loureiro V, Malfeito-Ferreira M. 2006. Dekkera/Brettanomyces spp. In: de W. Blackburn C (Editor). Food spoilage microorganisms. Oxford (UK): Elsevier. p. 354-98. DOI: 10.1533/9781845691417.3.354 DOI: https://doi.org/10.1533/9781845691417.3.354
Maneechot O, Hahor W, Thongprajukaew K, Nuntapong N, Bubaka S. 2023. A natural blue colorant from butterfly pea (Clitoria ternatea) petals for traditional rice cooking. J Food Sci Technol 60(8):2255-64. DOI: 10.1007/s13197-023-05752-w DOI: https://doi.org/10.1007/s13197-023-05752-w
McGlaughlin M, Karoly K, Kaye T. 2002. Genetic variation and its relationship to population size in reintroduced populations of pink sand verbena, Abronia umbellata subsp. breviflora (Nyctaginaceae). Conserv Genet 3(4):411-20. DOI: 10.1023/A:1020507416654 DOI: https://doi.org/10.1023/A:1020507416654
Mora F, Palma-Rojas C, Jara-Seguel P. 2005. Comparación del cariotipo de Eucalyptus globulus y Eucalyptus cladocalyx (Myrtaceae) [Comparison of karyotype of Eucalyptus globulus and Eucalyptus cladocalyx (Myrtaceae)]. Agric Téc 65(1):20-25. DOI: 10.4067/S0365-28072005000100002 DOI: https://doi.org/10.4067/S0365-28072005000100002
Naik A, Mishra SK, Nag A, Soren GK, Panda AK, Panda SK, Panigrahi J. 2020. Cross-genera amplification of Cajanus spp. specific SSR markers in Clitoria ternatea (L.) and their application in genetic diversity studies. Physiol Mol Biol Plants 26(12):2371-90. DOI: 10.1007/s12298-020-00907-x DOI: https://doi.org/10.1007/s12298-020-00907-x
Nidianti E, Subiastuti AS, Yusuf AF, Wibowo WA, Ramadhani PH, Daryono BS. 2023. Biological response and molecular identification of the Begomovirus infection in the new Indonesian melon genotype Kinaya. Pak J Phytopathol 35(2):223-34. DOI: 10.33866/phytopathol.035.02.0939 DOI: https://doi.org/10.33866/phytopathol.035.02.0939
Nilkanta H, Amom T, Tikendra L, Rahaman H, Nongdam P. 2017. ISSR marker based population genetic study of Melocanna baccifera (Roxb.) Kurz: A commercially important bamboo of Manipur, North-East India. Scientifica 2017:1-9. DOI: 10.1155/2017/3757238 DOI: https://doi.org/10.1155/2017/3757238
Nolan MJ, Cribb TH. 2005. The use and implications of ribosomal DNA sequencing for the discrimination of Digenean species. In: Baker JR, Muller R, Rollinson D. Advances in Parasitology. Vol.60. Oxford (UK): Elsevier. p.101-63. DOI: 10.1016/S0065-308X(05)60002-4 DOI: https://doi.org/10.1016/S0065-308X(05)60002-4
Nurhasanah, Hindersah R, Suganda T, Concibido V, Sundari, Karuniawan A. 2023. The first report on the application of ISSR markers in genetic variance detection among butterfly pea (Clitoria ternatea L.) accession in North Maluku Province, Indonesia. Horticulturae 9(9): 1059. DOI: 10.3390/horticulturae9091059 DOI: https://doi.org/10.3390/horticulturae9091059
Oguis GK, Gilding EK, Jackson MA, Craik DJ. 2019. Butterfly pea (Clitoria ternatea), a cyclotide-bearing plant with applications in agriculture and medicine. Front Plant Sci 10:645. DOI: 10.3389/fpls.2019.00645 DOI: https://doi.org/10.3389/fpls.2019.00645
Ojuederie OB, Nkang NA, Odesola KA, Igwe DO. 2020. Genetic diversity assessment of winged bean (Psophorcarpus tetragonolobus) accessions revealed by Inter-Simple Sequence Repeat (ISSR) markers. J Plant Biol Crop Res 3(1):1014.
Pere K, Mburu K, Muge EK, Wagacha JM, Nyaboga EN. 2023. Molecular discrimination and phylogenetic relationships of Physalis species based on ITS2 and rbcL DNA barcode sequence. Crops 3(4):302-19. DOI: 10.3390/crops3040027 DOI: https://doi.org/10.3390/crops3040027
Poczai P, Hyvönen J. 2010. Nuclear ribosomal spacer regions in plant phylogenetics: Problems and prospects. Mol Biol Rep 37(4):1897-1912. DOI: 10.1007/s11033-009-9630-3 DOI: https://doi.org/10.1007/s11033-009-9630-3
Porth I, El-Kassaby Y. 2014. Assessment of the genetic diversity in forest tree populations using molecular markers. Diversity 6(2): 283–295. DOI: 10.3390/d6020283 DOI: https://doi.org/10.3390/d6020283
Qahtan AA. 2021. Genetic diversity and structure analysis of a worldwide collection of Faba bean (Vicia faba) genotypes using ISSR markers. IJAB 25(03):683-91. DOI: 10.17957/IJAB/15.1717 DOI: https://doi.org/10.17957/IJAB/15.1717
Rahali N, Yangui I, Boussaid M, Messaoud C. 2022. Assessment of genetic diversity and population structure of the endemic Hertia cheirifolia (L.) Kuntze based on ISSR and SRAP molecular markers. Biologia 77(12):3429-39. DOI: 10.1007/s11756-022-01166-9 DOI: https://doi.org/10.1007/s11756-022-01166-9
Rajamanickam M, Kalaivanan P, Sivagnanam I. 2015. Evaluation of anti-oxidant and anti-diabetic activity of flower extract of Clitoria ternatea L. J App Pharm Sci 5(8):131-8. DOI: 10.7324/JAPS.2015.50820 DOI: https://doi.org/10.7324/JAPS.2015.50820
Reddy P, Sabara P, Padhiyar SM, Kulkarni GU, Kheni JV, Tomar RS. 2022. Genetic diversity of groundnut (Arachis hypogaea L.) revealed by RAPD and ISSR markers. Annals of Arid Zone 60(3):109-15.
Rosyidi IN, Yusuf AF, Sahroni M, Daryono BS. 2023. Detection of transposon gene in lurik peanuts (Arachis hypogaea var. lurik L.) with AhMITEs analysis. Int J Adv Sci Eng Inf Technol 13(4):1349-54. DOI: 10.18517/ijaseit.13.4.18269 DOI: https://doi.org/10.18517/ijaseit.13.4.18269
Sarwat M. 2012. ISSR: A reliable and cost-effective technique for detection of DNA polymorphism. In: Sucher NJ, Hennell JR, Carles MC (Editors). Plant DNA Fingerprinting and Barcoding. Totowa (US): Humana Press. p.103-21. DOI: 10.1007/978-1-61779-609-8_9 DOI: https://doi.org/10.1007/978-1-61779-609-8_9
Shiran B, Amirbakhtiar N, Kiani S, Mohammadi Sh, Sayed-Tabatabaei BE, Moradi H. 2007. Molecular characterization and genetic relationship among almond cultivars assessed by RAPD and SSR markers. Sci Hortic 111(3):280-92. DOI: 10.1016/j.scienta.2006.10.024 DOI: https://doi.org/10.1016/j.scienta.2006.10.024
Sokołowska J, Fuchs H, Celiński K. 2022. Assessment of ITS2 region relevance for taxa discrimination and phylogenetic inference among Pinaceae. Plants 11(8):1078. DOI: 10.3390/plants11081078 DOI: https://doi.org/10.3390/plants11081078
Suarna IW, Wijaya IMS. 2021. Butterfly pea (Clitoria ternatea L.: Fabaceae) and its morphological variations in Bali. J Trop Biodiv Biotechnol 6(2):63013. DOI: 10.22146/jtbb.63013 DOI: https://doi.org/10.22146/jtbb.63013
Sultana S, Lim YP, Bang J-W, Choi H-W. 2011. Internal transcribed spacer (ITS) and genetic variations in Lilium native to Korea. Hortic Environ Biotechnol 52(5):502-10. DOI: 10.1007/s13580-011-0050-7 DOI: https://doi.org/10.1007/s13580-011-0050-7
Surya D, Rajamani K, Uma D. 2022. Morphological characterization and assessment of anthocyanin in three different genotypes of Clitoria ternatea L. Pharma Innovation Journal 11(7):2388-92.
Tiwari G, Singh R, Singh N, Choudhury DR, Paliwal R, Kumar A, Gupta V. 2016. Study of arbitrarily amplified (RAPD and ISSR) and gene targeted (SCoT and CBDP) markers for genetic diversity and population structure in Kalmegh [Andrographis paniculata (Burm. f.) Nees]. Ind Crops Prod 86:1-11. DOI: 10.1016/j.indcrop.2016.03.031 DOI: https://doi.org/10.1016/j.indcrop.2016.03.031
Tripathi AM, Tyagi A, Kumar A, Singh A, Singh S, Chaudhary LB, Roy S. 2013. The Internal Transcribed Spacer (ITS) region and trnhH-psbA are suitable candidate loci for DNA barcoding of tropical tree species of India. PLoS ONE 8(2):e57934. DOI: 10.1371/journal.pone.0057934 DOI: https://doi.org/10.1371/journal.pone.0057934
Vander Stappen J, De Laet J, Gama-López S, Van Campenhout S, Volckaert G. 2002. Phylogenetic analysis of Stylosanthes (Fabaceae) based on the internal transcribed spacer region (ITS) of nuclear ribosomal DNA. Plant Syst Evol 234(1):27-51. DOI: 10.1007/s00606-002-0193-1 DOI: https://doi.org/10.1007/s00606-002-0193-1
Verma KS, Ul Haq S, Kachhwaha S, Kothari SL. 2017. RAPD and ISSR marker assessment of genetic diversity in Citrullus colocynthis (L.) Schrad: A unique source of germplasm highly adapted to drought and high-temperature stress. 3 Biotech 7(5):288. DOI: 10.1007/s13205-017-0918-z DOI: https://doi.org/10.1007/s13205-017-0918-z
Vijayan K, Chatterjee SN. 2003. ISSR profiling of Indian cultivars of mulberry (Morus spp.) and its relevance to breeding programs. Euphytica 131(1):53-63. DOI: 10.1023/A:1023098908110 DOI: https://doi.org/10.1023/A:1023098908110
Vilas R, Criscione CD, Blouin MS. 2005. A comparison between mitochondrial DNA and the ribosomal internal transcribed regions in prospecting for cryptic species of platyhelminth parasites. Parasitology 131(06):839. DOI: 10.1017/S0031182005008437 DOI: https://doi.org/10.1017/S0031182005008437
Wu C-T, Hsieh C-C, Lin W-C, Tang C-Y, Yang C-H, Huang Y-C, Ko Y-J. 2013. Internal transcribed spacer sequence-based identification and phylogenic relationship of I-Tiao-Gung originating from Flemingia and Glycine (Leguminosae) in Taiwan. J Food Drug Anal 21(4):356-62. DOI: 10.1016/j.jfda.2013.08.002 DOI: https://doi.org/10.1016/j.jfda.2013.08.002
Xu B, Zeng X-M, Gao X-F, Jin D-P, Zhang L-B. 2017. ITS non-concerted evolution and rampant hybridization in the legume genus Lespedeza (Fabaceae). Sci Rep 7(1):40057. DOI: 10.1038/srep40057 DOI: https://doi.org/10.1038/srep40057
Yeotkar SD, Malode SN, Waghmare VN, Thakre P. 2011. Genetic relationship and diversity analysis of Clitoria ternatea variants and Clitoria biflora using random amplified polymorphic DNA (RAPD) markers. Afr J Biotechnol 10(79):18065-70. DOI: 10.5897/AJB11.1423 DOI: https://doi.org/10.5897/AJB11.1423
Yusuf AF, Alfiyani A, Salsabila TAS, Kusnanda PS, Hidayati IN, Daryono BS. 2023. Assessment of maturity stage and stability of new Indonesian melon cultivar ‘Melona’ based on ISSR markers and morphological characteristics. Biodiversitas 24(1). DOI: 10.13057/biodiv/d240137 DOI: https://doi.org/10.13057/biodiv/d240137
Yusuf AF, Daryono BS. 2021. Studies of genetic and morphological characteristics of Indonesian melon (Cucumis melo L. ‘Hikapel’) germplasm. Int J Adv Sci Eng Inf Technol 11(5):2023-30. DOI: 10.18517/IJASEIT.11.5.14047 DOI: https://doi.org/10.18517/ijaseit.11.5.14047
Zebarjadi A, Ahmadvandi HR, Kahrizi D, Cheghamirza K. 2016. Assessment of genetic diversity by application of Inter Simple Sequence Repeat (ISSR) primers on Iranian Harmal (Peganum harmala L.) germplasm as an important medicinal plant. J Appl Biotechnol Rep 3(3):441-45.
Zhao L, Feng S, Tian J, Wei A, Yang T. 2018. Internal transcribed spacer 2 ( ITS 2) barcodes: A useful tool for identifying Chinese Zanthoxylum. Appl Plant Sci 6(6):e01157. DOI: 10.1002/aps3.1157 DOI: https://doi.org/10.1002/aps3.1157
Copyright (c) 2025 Adib Fakhruddin Yusuf, Vida Rahma Latifah, Vivi Indah Nurcahyati, Anggun Diyan Nurhasanah, Adristi Shafa Widyasari, Ananto Puradi Nainggolan, Aldy Riau Wansyah Hasibuan, Madyan Akmal Hidayat, Karmilah, Arini Dian Pratiwi, Rindu Aurantika, Muslifah Hasanah, Ganies Riza Aristya, Niken Satuti Nur Handayani, Tuty Arisuryanti, Indra Lesmana, Budi Setiadi Daryono

This work is licensed under a Creative Commons Attribution-NonCommercial-NoDerivatives 4.0 International License.
Authors who publish with this journal agree with the following terms:
- Authors retain copyright and grant the journal right of first publication, with the work 1 year after publication simultaneously licensed under a Creative Commons attribution-noncommerical-noderivates 4.0 International License that allows others to share, copy and redistribute the work in any medium or format, but only where the use is for non-commercial purposes and an acknowledgement of the work's authorship and initial publication in this journal is mentioned.
- Authors are able to enter into separate, additional contractual arrangements for the non-exclusive distribution of the journal's published version of the work (e.g., post it to an institutional repository or publish it in a book), with an acknowledgement of its initial publication in this journal.
- Authors are permitted and encouraged to post their work online (e.g., in institutional repositories or on their website) prior to and during the submission process, as it can lead to productive exchanges, as well as earlier and greater citation of published work (See The Effect of Open Access).