MORPHOLOGICAL AND MOLECULAR CHARACTERIZATION OF Donax faba (BIVALVIA: DONACIDAE) OBTAINED FROM KUTANG BEACH, LAMONGAN, INDONESIA

ARTICLE HIGLIGHTS
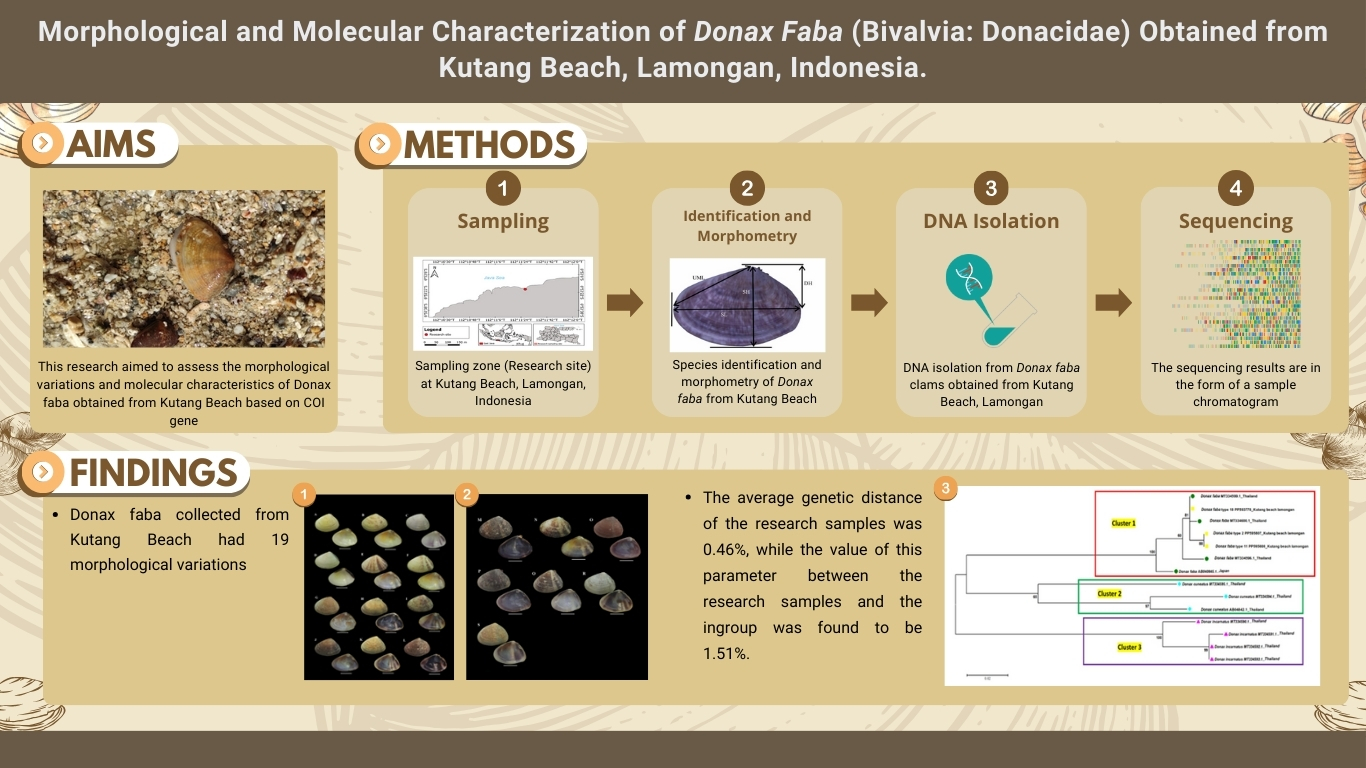
This study revealed 19 morphological variations of edible wedge clams, Donax faba (Bivalvia: Donacidae), from Kutang Beach, Lamongan, Indonesia, which has significant role as part of coastal ecosystem.
This reseach also highlights the DNA barcoding of Donax faba based on COI gene (Cytochrome C Oxidase Subunit I).
The average genetic distance of the research samples was 0.46%, while the value of this parameter between the research samples and the ingroup was found to be 1.51%.
ABSTRACT
Donax faba is a type of wedge clams with significant ecological and economic roles, as well as variations in color, pattern, and morphometric properties. Recently, a particular population of unidentified D. faba was reported from Kutang Beach, Lamongan, Indonesia. Therefore, this research aimed to assess the morphological variations and molecular characteristics of D. faba obtained from Kutang Beach based on COI gene. A total of 288 samples were collected during the lowest tide for morphological characterization of the color, pattern, and morphometrics of the shells. Additionally, molecular characterization was conducted based on the composition of nucleotide bases and amino acids of COI gene, genetic distance, as well as the relationships. The results showed that D. faba had 19 morphological variations, among which the most dominant type contained a whitish exterior with brown spots and a whitish purple interior. The average genetic distance of the samples was 0.46%, while the value was calculated as 1.51% between the samples and the ingroup. Automatic Barcode Gap Discovery (ABGD) analysis performed using a prior maximal distance of 0.001 showed the separation of these species into distinct categories.
INTRODUCTION
Donax faba is popularly known as wedge clams living in intertidal areas ((Ambarwati & Faizah, 2017); Alyani & Ambarwati 2018) along sandy beaches ((Yambem et al., 2017); (Rittiboon et al., 2019); (Signorelli & Printrakoon, 2020)) and mangrove forests (Singh et al., 2011); (Kassim et al., 2018). These clams are harvested in Vietnam and Thailand for the nutritional value (Krishnan & Tharavathy, 2016) and trade purposes (Poutiers, 1998), while being consumed in several regions of Indonesia including West Java (Dharma, 2005) and Madura (Ambarwati & Faizah, 2017); Alyani & Ambarwati 2018; (Wasilah et al., 2021)). Donax faba is capable of accumulating heavy metals (Singh et al., 2012); (Wasilah et al., 2021) and serves as a potential source of anticoagulant compounds (Periyasamy et al., 2013). Moreover, the shells can be processed into flour, serving as a mineral source in feedstuff (Lalopua & Sukisman, 2023).
Members of the Donacidae family, including D. faba, have been reported with morphological variations. (Tan & Low, 2013) detected variations in color, shape, and pattern among D. faba samples in Singapore, while (Rittiboon et al., 2019) identified eight color patterns from Bangling Beach, Thailand. Dharma (2005) described five types of D. faba shells collected from West Java. (Ambarwati & Faizah, 2017) as well as Alyani and Ambarwati (2018) reported 12 and 15 respective variations of patterns and colors from Nepa and Tengket Beaches in Madura. (Atlanta et al., 2022) recently found some D. faba at Kutang Beach, Lamongan, but morphological variations in this population remain unexplored.
High species variations often lead to difficulties in the identification process, which can only be enhanced by the availability of comprehensive information regarding the morphological variations. Additionally, DNA barcoding is among the current valuable tools used to strengthen identification based on morphological data (Moritz & Cicero, 2004); (Hebert & Gregory, 2005); (Ferri et al., 2009); (Packer et al., 2009).
Research across various animal taxa, including Porifera (Cárdenas et al., 2009); (, 2012), Echinoderms (Layton et al., 2016), Mollusca (Juniar et al., 2021); (Sari et al., 2021), and fish ((Rahayu et al., 2019); (Rahayu et al., 2012)), had used DNA barcoding markers for identification. COI DNA barcoding was previously applied to successfully identify variations in D. incarnatus from Madura (Wijaya et al., 2023). Additionally, genetic distance analysis based on COI gene sequences of certain samples showed high similarity with comparison species from GenBank and Bold systems. Differences in average genetic distance values can be caused by intragroup genetic diversity. A genetic distance is assumed to be very low when after conversion to less than 2% the values signify the same species. However, values greater than 2% suggest the existence of a species different from other group members (Wong & Hanner, 2008); (Wong et al., 2009)).
In an investigation performed by (Sari et al., 2021), genetic identification of D. faba from Nepa Beach, Madura showed COI gene sequence of 650 bp with similarity values ranging from 72.01% to 72.12% when compared to sequence data from GenBank. COI gene sequence of D. faba is characterized by a high mutation rate, leading to significant genetic variations and geographic influences on genetic plasticity. Consequently, further research is recommended to determine the molecular characteristics of D. faba.
Considering the provided background, this research aimed to assess the morphological variations and molecular characteristics of D. faba samples collected from Kutang Beach based on COI gene in mtDNA, followed by the conduction of phylogenetic relationship analysis. The molecular characterization and phylogenetic analysis data obtained will serve as a foundation for further investigation into the evolutionary history, population dynamics, and adaptation of D. faba in the natural habitat.
MATERIALS AND METHODS
Field Work
Samples of D. faba were collected from Kutang Beach, Lamongan (Figure 1) during the lowest tide. Five plots measuring 1 m x 1 m were placed horizontally along the beach line with 3 m interval between each plot. Samples for shell morphological analysis were preserved in 70% alcohol, then three from the most dominant shell types were selected and preserved in absolute alcohol for molecular analysis.
Laboratory Work
Identification and Morphometric Measurements
The shells of collected Donax clams were cleaned and identified using the identification books of (Poutiers, 1998), (Dharma, 2005), Huber (2010), and (Ambarwati & Faizah, 2017). Subsequently, morphometric measurements, including shell length (SL), shell height (SH), shell width (SW), dorsal height (DH), dorsal and umbo outline (Figure 2), were conducted using calipers with an accuracy of 0.01 mm (Ambarwati & Faizah, 2017). SL is defined as the perpendicular distance between the anterior and posterior shell, while SH is measured from the highest dorsal to the lowest ventral part of the shell. Furthermore, SW represents the distance between the protruding parts of the lateral sides of two shells. DH is measured from the highest part of the dorsal side to the pseudo line with a perpendicular distance between the anterior and posterior shell. The umbo margin line (UML) is described as the distance from the most dorsal part of the shell to the posterior.
Figure 1.The map showing the sampling location of D. faba (red dot) in Kutang Beach
Figure 2.Morphometric measurements of D. faba
Molecular Work (DNA Isolation and Sequencing)
Total DNA isolation from muscle tissue was performed using the Isolation Kit (Roche) (Kit catalogue number 05985536190) with several modifications. Initially, 200 µL of Buffer GT1 was pipetted into a 1.5 mL tube and mixed by vortexing. Next, 200 µL GT2 buffer and 20 µL Proteinase K were added, and the mixture was thoroughly combined through vortexing. The blend was incubated for 10 minutes at 56 °C, with gentle inversion of the tube every 5 minutes. Subsequently, 200 µL absolute ethanol was introduced to the mixture and briefly vortexed. The sample was transferred to Spin Column and centrifuged for 1 minute at 13,000 rpm. The resulting flow-through was discarded, and 500 µL buffer W1 was added, followed by another round of centrifugation for 1 minute at 13,000 rpm. After disposing of the flow-through, 700 µL buffer W2 containing ethanol was introduced and centrifuged for 1 minute at 13,000 rpm. The flow-through was discarded again, and centrifugation was conducted for an additional 2 minutes. DNA retained in Spin Column was transferred to a new 1.5 mL tube, then 50-100 µL Elution Buffer was added and incubated at room temperature for 1 minute before being centrifuged for 1 minute. Finally, Spin Column was removed, the purified DNA was prepared for further steps, and DNA was temporarily stored at -20 °C over a few days.
The isolation results were then amplified using Biorad PCR machine in a 30 µL solution consisting of 15 µL PCR Master Mix Nexpro, 3 µL DNA Template samples (100 ng/µL), 6 µL water, and 3 µL primers (10 pmol each of forward and reverse primers). The primers used were LCO1490 5'-GGTCAACAAATCATAAAGATATTGG-3' and HCO2198 (5'-TAAACTTCAGGGTGACCAAAAAATCA-3') (Folmer et al. 1994).
Amplification was performed with the following temperature settings including pre-denaturation at 94 ºC for 1 minute, followed by 40 cycles of denaturation at 94 ºC for 45 seconds, annealing at 45 ºC for 45 seconds, and extension at 72 ºC for 1 minute 30 seconds. Subsequently, the post-elongation process was carried out at a temperature of 72 ºC for 10 minutes. PCR results were electrophoresed on 1% agarose, then sequenced using 1st BASE Laboratories Sdn Bhd sequencing services.
Data Analysis
Analysis of Morphological and Morphometric Data
Morphological data were analyzed descriptively, while samples were classified based on shell color patterns, with the relative frequency of each type calculated as a percentage. Subsequently, the average and standard deviation of each morphometric parameter was estimated. Types comprising a minimum of 10 individuals (n ≥ 10) were analyzed for shell patterns using the ratio of each shell size and the relationship between patterns was evaluated through linear regression. To determine significant differences between types, analysis of variance (ANOVA) was conducted followed by the Games-Howell test.
Molecular Analysis
Sequence data from GenBank NCBI (National Center for Biotechnology Information) in addition to DNA sequence data obtained from this research was used for phylogenetic analysis (Table 1). DNA sequence readings were used to determine the genetic variations of COI gene, the composition of the nucleotide bases and amino acids of COI gene, as well as the genetic distance, followed by relationship analysis. Moreover, the chromatogram data from the sequencing results were visualized using FinchTV to assess sequence quality. The K2P substitution model (Saitou & Nei, 1987) was applied in calculating the settings for ML phylogenetic tree reconstructions. A bootstrap consensus tree inferred from 1,000 replicates was used to describe the variation rates among sites. Furthermore, adjacent branches showed the percentage of replicate trees in which the related taxa clustered together in the bootstrap test (1,000 repetitions). Grouping analysis was carried out through a web interface (Puillandre et al., 2012) to examine the distribution and size of a potential barcoding gap for the partial sequence of COI gene dataset. The barcode gap generated through Automatic Barcode Gap Discovery (ABGD) was used to strengthen the species identification process.
| Num | Species | Sample location | Acc number of genbank NCBI |
|---|---|---|---|
| 1. | Donax faba | Phuket, Thailand | MT334596.1 |
| 2. | Donax faba | Prachubkirikhun, Thailand | MT334599.1 |
| 3. | Donax faba | Rayong, Thailand | MT334600.1 |
| 4. | Donax faba | Japan | AB040845.1 |
| 5. | Donax incarnatus | Chantaburi, Thailand | MT334591.1 |
| 6. | Donax incarnatus | Phuket, Thailand | MT334590.1 |
| 7. | Donax incarnatus | Prachubkirikhun, Thailand | MT334593.1 |
| 8. | Donax incarnatus | Rayong, Thailand | MT334592.1 |
| 9. | Donax cuneatus | Chantaburi, Thailand | MT334594.1 |
| 10. | Donax cuneatus | Phuket, Thailand | MT334595.1 |
| 11. | Donax cuneatus | Japan | AB040842.1 |
| 12 | Donax faba type18 | Kutang Beach, Lamongan | PP593778 (this research) |
| 13 | Donax faba type 2 | Kutang Beach, Lamongan | PP595807 (this research) |
| 14 | Donax faba type 11 | Kutang Beach, Lamongan | PP595808 (this research) |
RESULTS AND DISCUSSION
Morphological Characterization
During the field trip to Kutang Beach, a population of D. faba clams was observed in the upper intertidal zone at the tidal boundary with a sandy substrate. This habitat type was consistent with previous research, which reported the habitat of D. faba as a sandy substrate ((Ambarwati & Faizah, 2017); (Tenjing, 2017); (Yambem et al., 2017)). The population of D. faba at Kutang Beach reached 57.6 ind./m2 with a total of 288 identified samples. Previous observation (Eshky, 1998) along the sandy substrate in the Red Sea showed that the population density of D. faba ranged from 30 to 296 ind./m2, corresponding to the results of this research.
The description of D. faba from Kutang Beach, Lamongan is as follows. Shell shape: thick, flat, inequilateral, trigonal oval. Shell length reaches 32.74 mm; shell height reaches 25.64 mm. Shell sculpture: smooth surface with thin concentric lines that become more prominent posteriorly. Umbo: protrude, prosogyrate. Color: white, cream, brown, purple; often with one or more radial bands or broad random patches; the interior of the shell is white, often with yellow shading, there are purplish to purple spots, and/or radial bands. Dentition: heterodont with anterior and posterior lateral teeth. Shell interior: anterior adductor muscle attachment site elongated and posterior adductor muscle attachment site rounded; deep pallial sinus (approximately ½ shell length); pallial line is clear (Figure 3 & Figure 4). This description corresponds to the reports of (Tan & Low, 2013), (Ambarwati & Faizah, 2017), and (Signorelli & Printrakoon, 2020).
The population of D. faba showed high morphological variations, including different interior and exterior shell color patterns, as well as shell morphometry. Samples collected at Kutang Beach had 19 variations in interior and exterior color (Figure 3 & 4; Table 2). Variations found with the highest relative frequency were types 18, 2, and 11 (Figure 5). Particularly, type 18 contained a white shell exterior and a whitish purple interior with a frequency of 18.1%. Type 2 showed a cream exterior shell color with brown spots and a yellowish-white interior, as well as a frequency of 13.5%. Type 11 comprised a cream exterior with brown spots and a brown interior with white spots, constituting 11.5% of D. faba population on Kutang Beach.
Type |
n |
Color |
Morphometry (mean±SD) | ||||
|---|---|---|---|---|---|---|---|
| SL (mm) | SH (mm) | SW (mm) | UML (mm) | DH (mm) | |||
| Type 1 | 13 | ext: yellowish white; int: white | 13.70±2.73a | 7.93±2.12a | 1.47±1.06a | 8.43±2.25a | 4.75±1.54a |
| Type 2 | 39 | ext: cream with brown maculation; int: yellowish white | 20.56±4.34b,c | 14.68±4.47c,d | 8.84±6.66b,c | 15.91±4.43c,d | 11.7±3.7c,d,e |
| Type 3 | 2 | ext: white; int: white with radial purple | 25.56±1.60 | 19.59±1.68 | 12.13±0.88 | 19.86±1.48 | 16.57±0.98 |
| Type 4 | 2 | ext: white with a radial band at posterior region; int: white with radial band at posterior region | 23.06±3.10 | 19.31±0.45 | 12.04±0.40 | 20.42±0.71 | 16.02±2.37 |
| Type 5 | 30 | ext: white with radial purple band; int: white | 20.90±5.51b,c | 15.53±4.51c,d | 9.23±3.80c | 16.75±5.03c,d | 12.58±4.15d,e |
| Type 6 | 27 | ext: cream with radial purple band; yellowish white | 21.06±3.23b,c | 15.32±2.58c,d | 7.94±2.03b,c | 14.08±2.88b,c | 9.97±2.49b,c,d |
| Type 7 | 1 | ext: light brown; light brown | 20.7±0.00 | 12.94±0.00 | 8.26±0.00 | 14.2±0.00 | 11.34±0.00 |
| Type 8 | 11 | ext: cream with brown maculation; int: dark purple | 23.21±2.22c | 16.35±1.13d | 9.01±1.02c | 15.04±2.26b,c,d | 12.22±2.57d,e |
| Type 9 | 11 | ext: dark brown with light brown maculation; int: brown with white maculation | 18.25±3.82a,b | 12.69±2.76b,c | 7.23±2.13b,c | 11.54±3.80a,b | 8.71±3.06b,c |
| Type 10 | 1 | ext: brown; int: brown | 24.02±0.00 | 17.64±0.00 | 9.07±0.00 | 15.94±0.00 | 13.41±0.00 |
| Type 11 | 33 | Ext: cream with brown maculation; Int: brown with white maculation | 19.20±2.16b,c | 13.62±1.40b,c,d | 7.13±7.13b,c | 15.30±2.62b,c,d | 10.2±2.65b,c,d |
| Type 12 | 2 | ext: brown with white maculation; int: dark brown | 14.03±3.00 | 9.70±2.07 | 5.05±1.46 | 10.30±2.84 | 6.65±2.75 |
| Type 13 | 6 |
ext: black with white maculation; int: deep dark |
19.84±2.08 | 14.36±1.91 | 7.61±1.29 | 14.98±2.20 | 11.35±2.51 |
| Type 14 | 10 | ext: cream with dark brown maculation; int: white with brown maculation | 15.09±2.93a | 10.49±2.21a,b | 5.29±1.21b | 11.73±2.12a,b | 7.74±2.14a,b |
| Type 15 | 8 | ext: dark brown; int: dark brown | 16.34±2.24 | 10.49±2.21a,b | 5.29±1.21b | 11.73±2.12a,b | 7.74±2.14a,b |
| Type 16 | 20 | ext: black with white spot: int: whitish black | 21.96±5.04b,c | 15.70±4.52c,d | 8.46±3.20b,c | 18.02±4.48d | 14.17±4.52e |
| Type 17 | 3 | ext: cream with white radial band; int: white | 18.33±3.34 | 13.22±2.57 | 7.10±2.04 | 15.58±3.61 | 10.03±2.88 |
| Type 18 | 52 | ext: white with brown spots; int: whitish purple | 19.70±3.43b,c | 14.27±2.87c,d | 7.42±1.60b,c | 15.22±2.92b,c,d | 10.06±2.6b,c,d |
| Type 19 | 17 | ext: cream with brown maculation; int: whitish purple | 19.52±2.82b,c | 14.20±2.37c,d | 7.18±1.49b,c | 15.37±2.81b,c,d | 10.3±2.48b,c,d |
| P value | 0.000* | 0.000* | 0.000* | 0.000* | 0.000* | ||
The results of morphometric measurements showed that each type of D. faba had different SL, SW, SH, DH, and UML (Table 2). Analysis identified variations in SL between types comprising 3 subsets, each representing a category with no significant difference in average SL value, while differences were observed between several subsets. Based on the morphometric measurements, types 1, 2, 5, 6, 8, 11, 16, 18, and 19 had different SL values. D. faba type 14 was significantly different from 2, 5, 6, 8, 11, 16, 18, and 19, while type 9 differed from 8. Type 1 had the lowest average SL of 13.7 mm, while type 8 had the highest measuring 23.21 mm. Additionally, the average SH of type 1 and 14 was significantly different from 2, 5, 6, 8, 11, 16, 18, and 19. Type 8 varied from 9, 11, and 18, with calculations showing that type 1 had the lowest average SH of 7.93 mm, while type 8 had the highest at 16.35 mm (Table 2). These dimensions were smaller than those observed for D. faba found in Nepa Beach (Ambarwati & Faizah, 2017), but larger than the values measured for samples collected from Tengket Beach (Alyani & Ambarwati 2018).
The shells had variations in sizes, pattern, and outline, with ratios including SW and SH, SW and SL, as well as SH and SL appearing significantly different among all types (Table 3). The relationship between shell size parameters was described using linear regression equations, with statistical test results showing different regression equations for each type. The shell size ratios of D. faba from Lamongan were similar to those measured in samples collected from Nepa Beach, Madura (Ambarwati & Faizah, 2017).
Figure 3.Morphological variations of D. faba collected from Kutang Beach, Lamongan Indonesia
Figure 4.Morphological variations of D. faba from Kutang Beach, Lamongan, Indonesia
| Measurement | n | Type | Ratio | Regression | ||
|---|---|---|---|---|---|---|
| Regression formula | P value regression | R-square | ||||
| SW and SH | 13 | Type 1 | 0.186a | SW = -2.095 + 0.45SHa | 0.000* | 0.811 |
| 39 | Type 2 | 0.602b | SW = -4.709 + 0.923SHc | 0.000* | 0.385 | |
| 30 | Type 5 | 0.595b | SW = -3.409 + 0.814SHc | 0.000* | 0.936 | |
| 27 | Type 6 | 0.518b | SW = -2.754 + 0.698SHc | 0.000* | 0.79 | |
| 11 | Type 8 | 0.551b | SW = -1.348 + 0.634SHc | 0.017* | 0.486 | |
| 11 | Type 9 | 0.570b | SW = -0.948 + 0.64SHb,c | 0.001* | 0.700 | |
| 33 | Type 11 | 0.523b | SW = 0.379 + 0.495SHd | 0.000* | 0.585 | |
| 10 | Type 14 | 0.505b | SW = 0.321 + 0.474SHb | 0.001* | 0.752 | |
| 20 | Type 16 | 0.539b | SW = -1.6 + 0.641SHc,d | 0.000* | 0.822 | |
| 52 | Type 18 | 0.520b | SW = 1.557 + 0.411SHd | 0.000* | 0.541 | |
| 17 | Type 19 | 0.506b | SW = -1.205 + 0.59SHd | 0.000* | 0.887 | |
| P value ANOVA | 0.000** | 0.000** | ||||
| SW and SL | 13 | Type 1 | 0.108a | SW = - 3.39 + 0.355SLa | 0.000* | 0.837 |
| 39 | Type 2 | 0.430b | SW = -9.141 + 0.875SLc,d | 0.000* | 0.326 | |
| 30 | Type 5 | 0.442b | SW = -4.540 + 0.659SLc,d | 0.000* | 0.915 | |
| 27 | Type 6 | 0.377b | SW = -3.664 + 0.551SLc,d | 0.000* | 0.770 | |
| 11 | Type 8 | 0.388b | SW = 2.817 + 0.267SLd | 0.062 | 0.336 | |
| 11 | Type 9 | 0.396b | SW = 0.514 + 0.368SLb,c | 0.027* | 0.435 | |
| 33 | Type 11 | 0.371b | SW = -0.719 + 0.409SLb,c | 0.000* | 0.584 | |
| 10 | Type 14 | 0.351b | SW = -0.108 + 0.358SLb | 0.001* | 0.753 | |
| 20 | Type 16 | 0.385b | SW = -4.04 + 0.569SLd | 0.000* | 0.805 | |
| 52 | Type 18 | 0.376b | SW = 1.362 + 0.307SLb,c | 0.000* | 0.432 | |
| 17 | Type 19 | 0.368b | SW = -2.27 + 0.484SLb,c,d | 0.000* | 0.840 | |
| P value ANOVA | 0.000** | 0.000** | ||||
| SH and SL | 13 | Type 1 | 0.579a | SH = -1.865 + 0.715SLa | 0.000* | 0.847 |
| 39 | Type 2 | 0.714b | SH = -5.487 + 0.981SLc,d | 0.000* | 0.907 | |
| 30 | Type 5 | 0.743b | SH = -0.815 + 0.782SLc,d | 0.000* | 0.913 | |
| 27 | Type 6 | 0.727b | SH = -0.805 + 0.766SLc,d | 0.000* | 0.917 | |
| 11 | Type 8 | 0.704b | SH = 8.568 + 0.335SLd | 0.027* | 0.438 | |
| 11 | Type 9 | 0.695b | SH = 2.02 + 0.585SLb,c | 0.003* | 0.651 | |
| 33 | Type 11 | 0.709b | SH = 0.683 + 0.674SLc | 0.000* | 0.666 | |
| 10 | Type 14 | 0.695b | SH = -0.718 + 0.743SLa,b | 0.000* | 0.968 | |
| 20 | Type 16 | 0.715b | SH = -2.91 + 0.847SLc,d | 0.000* | 0.892 | |
| 52 | Type 18 | 0.724b | SH = 0.288 + 0.709SLc | 0.000* | 0.719 | |
| 17 | Type 19 | 0.728b | SH = -1.27 + 0.793SLc | 0.000* | 0.884 | |
| P value ANOVA | 0.000** | 0.000** | ||||
Figure 5.Relative frequency of morphological pattern of D. faba from Kutang Beach
Molecular Characterization
Molecular characterization was performed based on the sequence of Cytochrome C Oxidase subunit I (COI) gene using three samples of D. faba which had the highest relative frequency of morphological variations.
COI gene barcode sequence data among the three research samples showed an average composition of G+C nucleotide base at 41.7% and A+T nucleotide base at 58.3%. According to the average results, the nucleotide base composition of G+C was lower than A+T. Furthermore, the G+C and A+T content could provide insights into the evolutionary history and relationships of D. faba. Comparing these values with those of related species would clarify genetic divergence, hybridization events, and adaptive evolution processes of D. faba. The average G+C and A+T nucleotide base compositions in COI gene barcode sequence data offered valuable information about the genetic characteristics and evolutionary dynamics of D. faba.
| Sample names | Three highest BOLD identification |
Similarity (%) |
Status |
|---|---|---|---|
| D. faba Type 18 | D. faba | 99.53 | Published |
| D. faba | 99.53 | Published | |
| D. faba | 99.37 | Published | |
| D. faba Type 2 | D. faba | 99.21 | Published |
| D. faba | 99.21 | Published | |
| D. faba | 99.06 | Published | |
| D. faba Type 11 | D. faba | 98.58 | Published |
| D. faba | 98.58 | Published | |
| D. faba | 98.43 | Published |
| Samples |
A (%) |
C (%) |
G (%) |
T (%) |
A+T (%) |
G+C (%) |
|---|---|---|---|---|---|---|
| Donax faba Type 18 | 20.9 | 19.9 | 21.6 | 37.7 | 58.6 | 41.4 |
| Donax faba Type 2 | 21.2 | 19.9 | 21.9 | 37.0 | 58.2 | 41.8 |
| Donax faba Type 11 | 21.2 | 19.9 | 21.9 | 37.0 | 58.2 | 41.7 |
| Average | 21.1 | 19.9 | 21.8 | 37.2 | 58.3 | 41.7 |
| Num. | Species | Nucleotide Base Variations | |
|---|---|---|---|
| 134 | 184 | ||
| 1. | Donax faba MT334596.1 | T | T |
| 2. | Donax faba MT334599.1 | ● | ● |
| 3. | Donax faba MT334600.1 | ● | ● |
| 4. | Donax faba AB040845.1 | ● | ● |
| 5. | Donax faba Type 18 PP593778 (this research) | ● | ● |
| 6. | Donax faba Type 2 PP595807 (this research) | G | A |
| 7. | Donax faba Type 11 PP595808 (this research) | G | A |
| 8. | Donax cuneatus MT334594.1 | ● | ● |
| 9. | Donax cuneatus MT334595.1 | ● | ● |
| 10. | Donax cuneatus AB040842.1 | ● | ● |
| 11. | Donax incarnatus MT334590.1 | ● | ● |
| 12. | Donax incarnatus MT334591.1 | ● | ● |
| 13. | Donax incarnatus MT334592.1 | ● | ● |
| 14. | Donax incarnatus MT334593.1 | ● | ● |
Table 5 shows transition and transversion mutations of COI gene nucleotide sequence of the samples when compared to related species. Transversion substitution of nucleotide base number 134 presented a change in base T (Thymine) to base G (Guanine). Additionally, the transition substitution of nucleotide base number 184 included a change in base T (Thymine) to A (Adenine). The results showed that two unique nucleotide base patterns, known as automorphic nucleotide bases, were exclusively present in D. faba samples. Automorphic nucleotide bases were specific to D. faba from Kutang Beach, distinguishing this population from other species (Table 6). Jannah & Rahayu (2019) and (Priyono et al., 2018) reported that certain species had automorphic nucleotide bases as distinctive markers or features used for differentiation from other species under comparison. (Zhang & Zhao, 2004) stated that the transversion substitution would elevate with increasing AT base composition in the sequence.
The exploration of collected D. faba samples and the ingroup showed an average genetic distance of 0.46%, representing the average genetic divergence among the samples investigated. Genetic distance is a measure of the genetic divergence between populations or individuals, often quantified based on genetic markers such as DNA sequences (Priyono et al., 2018). Furthermore, the average genetic distance between the research samples and the ingroup was determined to be 1.51%. This value showed the average genetic differentiation between D. faba and the ingroup, which could consist of related species or other reference samples. The differences in the composition of the nucleotide bases in each sequence signified the existence of genetic variation between species (, 2020). Moreover, (, 2016) stated that a genetic distance value of < 2% showed the group comprised the same species, and > 2% suggested the group was a different species from other members. This signified that the samples collected from Kutang Beach were identified as one species with D. faba. (Chiu et al., 2013) reported various factors such as environmental conditions, overexploitation, and geographical location to be capable of influencing the diversity of genetic distances in a species. Additionally, certain environmental factors could impact the morphology and phylogenetic characteristics of populations in a species.
The reconstruction of the phylogenetic tree of D. faba showed the existence of three clusters (Figure 6). Cluster 1 consisted of two clades, namely D. faba research samples (featuring a bootstrap value of 70-88) along with the close relative originating from Thailand and Japan. Cluster 2 consisted of D. cuneatus originating from Thailand and Japan, while Cluster 3 comprised D. incarnatus originating from Thailand.
| Samples | 1 | 2 | 3 | 4 | 5 | 6 | 7 | 8 | 9 | 10 | 11 | 12 | 13 |
|---|---|---|---|---|---|---|---|---|---|---|---|---|---|
| Donax faba MT334596.1 | |||||||||||||
| Donax faba MT334599.1 | 1.39 | ||||||||||||
| Donax faba MT334600.1 | 1.74 | 0.34 | |||||||||||
| Donax faba AB040845.1 | 3.16 | 2.44 | 2.80 | ||||||||||
| Donax faba Type 18 PP593778 (this research) | 1.39 | 0.00 | 0.34 | 2.44 | |||||||||
| Donax faba Type 2 PP595807 (this research) | 2.09 | 0.69 | 1.03 | 3.15 | 0.69 | ||||||||
| Donax faba Type 11 PP595808 (this research) | 2.09 | 0.69 | 1.03 | 3.15 | 0.69 | 0.00 | |||||||
| Donax cuneatus MT334594.1 | 18.76 | 19.22 | 18.76 | 19.19 | 19.22 | 20.09 | 20.09 | ||||||
| Donax cuneatus MT334595.1 | 17.30 | 17.75 | 17.30 | 16.47 | 17.75 | 18.61 | 18.61 | 14.96 | |||||
| Donax cuneatus AB040842.1 | 17.81 | 18.27 | 17.81 | 17.84 | 18.27 | 19.13 | 19.13 | 5.37 | 13.24 | ||||
| Donax incarnatus MT334590.1 | 21.81 | 21.33 | 20.86 | 22.31 | 21.33 | 22.23 | 22.23 | 19.94 | 20.09 | 20.42 | |||
| Donax incarnatus MT334591.1 | 23.19 | 22.71 | 22.23 | 23.71 | 22.71 | 23.63 | 23.63 | 20.36 | 19.16 | 21.78 | 4.63 | ||
| Donax incarnatus MT334592.1 | 22.23 | 21.76 | 21.29 | 22.74 | 21.76 | 22.67 | 22.67 | 20.36 | 19.16 | 20.84 | 3.89 | 0.69 | |
| Donax incarnatus MT334593.1 | 22.23 | 21.76 | 21.29 | 22.74 | 21.76 | 22.67 | 22.67 | 20.36 | 19.16 | 20.84 | 3.89 | 0.69 | 0.00 |
Figure 6.Phylogenetic topology determined using the Neighbor-Joining Method
Figure 7.Phylogenetic topology determined using Maximum Likelihood Method
Figure 8. Barcode Gap Analysis of COI sequences performed through ABGD (Puillandre et al., 2012)
The reconstruction of D. faba phylogenetic tree using Neighbour Joining (NJ) and Maximum Likelihood (ML) methods showed the existence of three clusters (Figure 8; (Puillandre et al., 2012)). Cluster 1 consisted of two clades, namely D. faba research samples (featuring a bootstrap value of 100) along with the close relative originating from Thailand and Japan. Cluster 2 comprised D. cuneatus which originated from Thailand and Japan, while Cluster 3 consisted of D. incarnatus originating from Thailand. The phylogenetic trees showed that D. faba and the close relative species formed distinct monophyletic branches. However, the proximity at the same node presented genetic relatedness and the positioning of these branches corresponded with a calculated genetic distance of 0.46%, signifying the greatest divergence between each species. NJ, ML, and genetic distance data collectively provided strong evidence that D. faba and the close relatives were genetically distant from each other.
ABGD was used to identify five distinct groups for D. faba and the relatives based on the initial method and the bar-code gap threshold calculated by COI dataset, as shown in Figure 8A and Figure 8B. The barcode gap distance value of 0.001 corresponded with the results of ABGD grouping which divided the species into five groups (Figure 8C). These were categorized as Group [1] (Donax faba 1, D. faba 2, and D. faba 3); Group [2] (D. faba MT334596.1 and D. faba MT334599.1); Group [3] (D. faba MT334600.1 and D. faba AB040845.1); Group [4] (D. cuneatus MT334594.1 and D. cuneatus MT334595.1 and D. cuneatus AB040842.1); and Group [5] (D. incarnatus MT334590.1, D. incarnatus MT334591.1, and D. incarnatus MT334592.1. The application of ABGD analysis, with a prior maximal distance set at 0.001, further strengthened the separation of D. faba and other species in the ingroup into distinct categories. Therefore, D. faba was successfully identified by the combined use of genetic distance, phylogenetic analysis, and ABGD analysis. Based on the comprehensive data obtained through DNA barcoding combined with morphological characteristics, it could be inferred that the focused application of these tools provided a reliable and effective means of identifying D. faba at the species level.
CONCLUSION
D. faba collected from Kutang Beach had 19 morphological variations. The average genetic distance of the research samples was 0.46%, while the value of this parameter between the research samples and the ingroup was found to be 1.51%.
References
- Ambarwati R., Faizah U.. Colour and morphometric variation of donacid bivalves from Nepa Beach, Madura Island, Indonesia. Biosaintifika J Biol Biol Educ. 2017; 9(3):466-73.
- Atlanta V., Ambarwati R., Rahayu D.A., Mujiono N.. Diversity of bivalves on the north coast of Lamongan, East Java, Indonesia. Biodiversitas. 2022; 23(8):4263-71.
- Cárdenas P., Menegola C., Rapp H.T., Díaz M.C.. Morphological description and DNA barcodes of shallow-water Tetractinellida (Porifera: Demospongiae) from Bocas del Toro, Panama, with description of a new species. Zootaxa. 2009; 2276):1-39
- Identification of deer species (Cervidae, Cetartiodactyla) in China using mitochondrial cytochrome c oxidase subunit I (mtDNA COI). Mitochondrial DNA Part A DNA Mapping. Seq Anal. 2016; 27(6):4240-3. DOI
- Chiu Y.W., Bor H., Tan M.S., Lin H.D., Jean C.T.. Phylogeography and genetic differentiation among populations of the moon turban snail Lunella granulata Gmelin 1791 (Gastropoda: Turbinidae. Intl J Mol Sci. 2013; 14(5):9062-79. DOI
- Dharma B.. Conchbooks: Hackenheim (DE; 2005.
- Eshky A.A.. Ecological Behaviour and Biology of the Beach Clam Donax faba (Gmelin) from the Red Sea. J King Abdulaziz Univ. 1998; 10(1):47-72.
- Ferri G., Alù M., Corradini B., Licata M., Beduschi G.. Species identification through DNA ‘barcodes’. Genet Test Mol Biomarkers. 2009; 13(3):421-6.
- Filzan A., Ambarwati R.. Morphological variations and abundance of Donax faba. BIOTROPIC. 2018; 2(2):73-84.
- Hebert P.D.N., Gregory T.R.. The promise of DNA barcoding for taxonomy. Syst Biol. 2005; 54(5):852-9.
- Juniar A., Ambarwati R., Rahayu D.A.. Genetic identification of Clithon oualaniense (Gastropoda: Neritidae) from Madura, Indonesia. AACL Bioflux. 2021; 14(2):1046-56.
- Kassim Z., Ahmad Z., Ismail N.. Diversity of bivalves in mangrove forest, Tok Bali Kelantan, Malaysia. Sci Herit J. 2018; 2(2):04-09.
- Krishnan S., Tharavathy N.C.. Biochemical Composition of Donax spp . of Kushalnagar Beach, West Coast, Kerala Shini Krishnan. Bioscience. 2016; 5(6):370-2.
- Lalopua V., Sukisman A.H.. Characteristics of clamshell flour Donax sp from Sapola sub-village of Seram Island. IOP Conf Ser: Earth Environ Sci. 2023; 1207012028
- Layton K.K.S., Corstorphine E.A., Hebert P.D.N.. Exploring Canadian echinoderm diversity through DNA barcodes. PLoS ONE. 2016; 11(11)
- Moritz C., Cicero C.. DNA barcoding: Promise and pitfalls. PLoS Biology. 2004; 2(10):279-354.
- Nugroho E., Nawir D.. DNA barcoding of nomei fish (Synodontidae: Harpadon sp.) in Tarakan Island, Indonesia. AACL Bioflux. 2017; 10(6):1466-74.
- Packer L., Gibbs J., Sheffield C., Hanner R.. DNA barcoding and the mediocrity of morphology. Mol Ecol Resour. 2009; 9(SUPPL. 1):42-50.
- Periyasamy N., Murugan S., Bharadhirajan P.. Isolation and characterization of anticoagulant compound from marine mollusc Donax faba (Gmelin, 1791) from Thazhanguda, Southeast Coast of India. African J Biotechnol. 2013; 12(40):5968-74.
- Poutiers J.M.. FAO Species Identification Guide for Fishery Purposes; The Living Marine Resources of the Western Central Pacific. ; 1998.
- Puillandre N., Lambert A., Brouillet S., Achaz G.. ABGD, Automatic Barcode Gap Discovery for primary species delimitation. Mol Ecol. 2012; 21(8):1864-77.
- Priyono D.S., Solihin D.D., Farajalah A., Arini A.F.. Anoa, dwarf buffalo from Sulawesi, Indonesia: Identification based on DNA barcode. Biodiversitas. 2018; 19(6):1985-92.
- Rahayu D.A., Nugroho E.D., Listyorini D.. DNA Barcoding Ikan Introduksi Khas Telaga Sari, Kabupaten Pasuruan. Biotropika. 2019; 7(2):51-62.
- Rahayu D.A., Nugroho E.D., Kurniawan N., Azrianingzih R.. Prosiding Seminar Nasional Ikan ke-8. 2012:67-75.
- Rittiboon K., Fungchonjitt S., Thongroy P., Chavavongsa C., Buatip S.. Some Aspects of Ecology of Wedge Clam, Donax faba Gmelin, 1791 at Bangling Beach, Thepha District, Songkhla Province. Burapha Sci J. 2019; 24(1):395-414.
- Saitou N., Nei M.. The neighbor-joining method: A new method for reconstructing phylogenetic trees. Mol Bio Evol. 1987; 4:406-25.
- Growth pattern analysis and DNA barcoding approach for identification of Turbo stenogyrus P. Fischer 1873 (Mollusca: Gastropoda. Biotropika. 2020; 8(2):79-86. DOI
- Sari S.Y.P., Ambarwati R., Rahayu D.A.. Molecular characteristics of Donax faba (Bivalvia: Donacidae) from Nepa Beach, Madura, based on cytochrome oxidase subunit I gene sequences. AACL Bioflux. 2021; 14(4):2416-26.
- Signorelli J.H., Printrakoon C.. The family Donacidae (Bivalvia: Tellinoidea) in Thai waters. Molluscan Res. 2020; 40(1):8-35.
- Singh Y.T., Krishnamoorthy M., Thippeswamy S.. Population Ecology of the Wedge Clam Donax faba (Gmelin) from the Panambur Beach, Near Mangalore, South West Coast of India. J Theor Exp Biol. 2011; 7(4):171-82.
- Singh Y.T., Krishnamoorthy M., Thippeswamy S.. Seasonal Variations of Cu, Pb, Fe, Ni and Cr in the Edible Wedge Clam, Donax faba (Mollusca, Bivalvia) from the Padukere Beach, Karnataka. J Theor Exp Biol. 2012; 8(3 & 4):95-100.
- Tan S.K., Low M.E.Y.. Singapore Mollusca: 3. the Family Donacidae (Bivalvia: Veneroida: Tellinoidea. Nat Singapore. 2013; 6:257-63.
- Tenjing S.Y.. Short communication: Population dynamics of Donax faba (Family: Donacidae) in the coastal waters of Padukere, Karnataka (India. Iran J Fish Sci. 2017; 16(1):411-21.
- Barcoding sponges: An overview based on comprehensive sampling. PLoS ONE. 2012; 7(7)
- Wasilah Q.A., Mawli R.E., Sani M.D., Soegianto A., Wiradana P.A., Pradisty N.A.. Determination of Lead and Cadmium in Edible Wedge Clam. 2021.
- Wijaya C.B., Ambarwati R., Rahayu D.A.. Morphological and molecular characteristics of Donax incarnatus (Bivalvia: Donacidae) from Badur Beach, Madura Island, Indonesia based on the COX1 gene. Biodiversitas. 2023; 24(5):2805-13.
- Wong E.H.K., Shivji M.S., Hanner R.H.. Identifying sharks with DNA barcodes: assessing the utility of a nucleotide diagnostic approach. Mol Ecol Resour. 2009; 9(Suppl. 1):243-56.
- Wong E.H.K., Hanner R.H.. DNA barcoding detects market substitution in North American seafood. Food Res Int J. 2008; 41(8):828-37.
- Yambem T., Samuel V.D., Meenakshi V.K., Sankar S., Narasimhaiah N.. Intertidal biodiversity of Karnataka coast, south west coast of India. Perspectives on Biodiversity of India. 2017; III:186-92.
- Zhang F., Zhao Z.. The influence of neighboring-nucleotide composition on single nucleotide polymorphisms (SNPs) in mouse genome and its comparison with human SNPs. Genomics. 2004; 84(5):785-95.
Ambarwati R, Faizah U. 2017. Colour and morphometric variation of donacid bivalves from Nepa Beach, Madura Island, Indonesia. Biosaintifika J Biol Biol Educ 9(3):466-73. DOI: https://doi.org/10.15294/biosaintifika.v9i3.11267
Atlanta V, Ambarwati R, Rahayu DA, Mujiono N. 2022. Diversity of bivalves on the north coast of Lamongan, East Java, Indonesia. Biodiversitas 23(8):4263-71. DOI: https://doi.org/10.13057/biodiv/d230850
Cárdenas P, Menegola C, Rapp HT, Díaz MC. 2009. Morphological description and DNA barcodes of shallow-water Tetractinellida (Porifera: Demospongiae) from Bocas del Toro, Panama, with description of a new species. Zootaxa (2276):1-39. DOI: https://doi.org/10.11646/zootaxa.2276.1.1
Cai Y, Zhang L, Wang Y, Liu Q, Shui Q, Yue B, …, Li J. 2016. Identification of deer species (Cervidae, Cetartiodactyla) in China using mitochondrial cytochrome c oxidase subunit I (mtDNA COI). Mitochondrial DNA Part A DNA Mapping. Seq Anal 27 (6):4240-3. DOI: 10.3109/19401736.2014.1003919. DOI: https://doi.org/10.3109/19401736.2014.1003919
Chiu YW, Bor H, Tan MS, Lin HD, Jean CT. 2013. Phylogeography and genetic differentiation among populations of the moon turban snail Lunella granulata Gmelin 1791 (Gastropoda: Turbinidae). Intl J Mol Sci 14 (5):9062-79. DOI: 10.3390/ijms14059062. DOI: https://doi.org/10.3390/ijms14059062
Dharma B. 2005. Recent and Fossil Indonesian Shells. Hackenheim (DE): Conchbooks. 424 pp.
Eshky AA. 1998. Ecological Behaviour and Biology of the Beach Clam Donax faba (Gmelin) from the Red Sea. J King Abdulaziz Univ 10(1):47-72. DOI: https://doi.org/10.4197/Sci.10-1.5
Ferri G, Alù M, Corradini B, Licata M, Beduschi G. 2009. Species identification through DNA ‘barcodes’. Genet Test Mol Biomarkers 13(3):421-6. DOI: https://doi.org/10.1089/gtmb.2008.0144
Filzan A, Ambarwati R. 2018. Morphological variations and abundance of Donax faba (Bivalvia: Donacidae) on Tengket Beach, Bangkalan, Madura. BIOTROPIC 2(2):73-84. (Indonesian). DOI: https://doi.org/10.29080/biotropic.2018.2.2.73-84
Hebert PDN, Gregory TR. 2005 The promise of DNA barcoding for taxonomy. Syst Biol 54(5):852-9. DOI: https://doi.org/10.1080/10635150500354886
Juniar A, Ambarwati R, Rahayu DA. 2021. Genetic identification of Clithon oualaniense (Gastropoda: Neritidae) from Madura, Indonesia. AACL Bioflux 14(2):1046-56.
Kassim Z, Ahmad Z, Ismail N. 2018. Diversity of bivalves in mangrove forest, Tok Bali Kelantan, Malaysia. Sci Herit J 2(2):04-09. DOI: https://doi.org/10.26480/gws.02.2018.04.09
Krishnan S, Tharavathy NC. 2016. Biochemical Composition of Donax spp . of Kushalnagar Beach, West Coast, Kerala Shini Krishnan. Bioscience 5(6):370-2.
Lalopua V, Sukisman AH. 2023. Characteristics of clamshell flour Donax sp from Sapola sub-village of Seram Island. IOP Conf Ser: Earth Environ Sci. 1207012028 DOI: https://doi.org/10.1088/1755-1315/1207/1/012028
Layton KKS, Corstorphine EA, Hebert PDN. 2016. Exploring Canadian echinoderm diversity through DNA barcodes. PLoS ONE 11(11): e0166118. DOI: https://doi.org/10.1371/journal.pone.0166118
Moritz C, Cicero C. 2004. DNA barcoding: Promise and pitfalls. PLoS Biology 2(10): e279-e354. DOI: https://doi.org/10.1371/journal.pbio.0020354
Nugroho E, Nawir D. 2017. DNA barcoding of nomei fish (Synodontidae: Harpadon sp.) in Tarakan Island, Indonesia. AACL Bioflux 10(6):1466-74.
Packer L, Gibbs J, Sheffield C, Hanner R. 2009. DNA barcoding and the mediocrity of morphology. Mol Ecol Resour 9(SUPPL. 1):42-50. DOI: https://doi.org/10.1111/j.1755-0998.2009.02631.x
Periyasamy N, Murugan S, Bharadhirajan P. 2013. Isolation and characterization of anticoagulant compound from marine mollusc Donax faba (Gmelin, 1791) from Thazhanguda, Southeast Coast of India. African J Biotechnol 12(40):5968-74. DOI: https://doi.org/10.5897/AJB2013.12823
Poutiers JM, 1998. Bivalves (Acephala, Lamellibranchia, Pelecypoda). In: Carpenter KE, Niem VH (Editors), FAO Species Identification Guide for Fishery Purposes; The Living Marine Resources of the Western Central Pacific Volume 1. Rome (IT): Food and Agriculture Organization of the United Nations.
Puillandre N, Lambert A, Brouillet S, Achaz G. 2012. ABGD, Automatic Barcode Gap Discovery for primary species delimitation. Mol Ecol 21(8):1864-77. DOI: https://doi.org/10.1111/j.1365-294X.2011.05239.x
Priyono DS, Solihin DD, Farajalah A, Arini AF. 2018. Anoa, dwarf buffalo from Sulawesi, Indonesia: Identification based on DNA barcode. Biodiversitas 19(6):1985-92. DOI: https://doi.org/10.13057/biodiv/d190602
Rahayu DA, Nugroho ED, Listyorini D. 2019. DNA Barcoding Ikan Introduksi Khas Telaga Sari, Kabupaten Pasuruan. Biotropika 7(2):51-62. DOI: https://doi.org/10.21776/ub.biotropika.2019.007.02.2
Rahayu DA, Nugroho ED, Kurniawan N, Azrianingzih R. 2012. DNA Barcode dan Haplotype Network Ikan Lokal Dari Telaga Banyu Biru Kabupaten Pasuruan. In: Prosiding Seminar Nasional Ikan ke-8. p.67-75.
Rittiboon K, Fungchonjitt S, Thongroy P, Chavavongsa C, Buatip S. 2019. Some Aspects of Ecology of Wedge Clam, Donax faba Gmelin, 1791 at Bangling Beach, Thepha District, Songkhla Province. Burapha Sci J 24(1):395-414.
Saitou N, Nei M. 1987. The neighbor-joining method: A new method for reconstructing phylogenetic trees. Mol Bio Evol 4:406-25.
Saleky DPO, Leatemia SF, Pattiasina T, Isma I, Pangaribuan RD, Welliken MA, …, Dailami M. 2020. Growth pattern analysis and DNA barcoding approach for identification of Turbo stenogyrus P. Fischer 1873 (Mollusca: Gastropoda). Biotropika 8(2):79-86. DOI: 10.21776/ub.biotropika.2020.008.02.03. (Indonesian) DOI: https://doi.org/10.21776/ub.biotropika.2020.008.02.03
Sari SYP, Ambarwati R, Rahayu DA. 2021. Molecular characteristics of Donax faba (Bivalvia: Donacidae) from Nepa Beach, Madura, based on cytochrome oxidase subunit I gene sequences. AACL Bioflux 14(4):2416-26.
Signorelli JH, Printrakoon C. 2020. The family Donacidae (Bivalvia: Tellinoidea) in Thai waters. Molluscan Res 40(1):8-35. DOI: https://doi.org/10.1080/13235818.2019.1655134
Singh YT, Krishnamoorthy M, Thippeswamy S. 2011. Population Ecology of the Wedge Clam Donax faba (Gmelin) from the Panambur Beach, Near Mangalore, South West Coast of India. J Theor Exp Biol 7(4):171-82.
Singh YT, Krishnamoorthy M, Thippeswamy S. 2012. Seasonal Variations of Cu, Pb, Fe, Ni and Cr in the Edible Wedge Clam, Donax faba (Mollusca, Bivalvia) from the Padukere Beach, Karnataka. J Theor Exp Biol 8(3 & 4):95-100.
Tan SK, Low MEY. 2013. Singapore Mollusca: 3. the Family Donacidae (Bivalvia: Veneroida: Tellinoidea). Nat Singapore 6:257-63.
Tenjing SY. 2017. Short communication: Population dynamics of Donax faba (Family: Donacidae) in the coastal waters of Padukere, Karnataka (India). Iran J Fish Sci 16(1):411-21.
Vargas S, Schuster A, Sacher K, Büttner G, Schätzle S, Läuchli B, …, Wörheide G. 2012. Barcoding sponges: An overview based on comprehensive sampling. PLoS ONE 7(7):e39345. DOI: https://doi.org/10.1371/journal.pone.0039345
Wasilah QA, Mawli RE, Sani MD, Soegianto A, Wiradana PA, Pradisty NA, 2021. Determination of Lead and Cadmium in Edible Wedge Clam (Donax faba) Collected from North and South Coasts of Sumenep, East Java, Indonesia. Poll Res 40(2):593-7.
Wijaya CB, Ambarwati R, Rahayu DA, 2023. Morphological and molecular characteristics of Donax incarnatus (Bivalvia: Donacidae) from Badur Beach, Madura Island, Indonesia based on the COX1 gene. Biodiversitas 24(5):2805-13. DOI: https://doi.org/10.13057/biodiv/d240534
Wong EHK, Shivji MS, Hanner RH. 2009. Identifying sharks with DNA barcodes: assessing the utility of a nucleotide diagnostic approach. Mol Ecol Resour 9(Suppl. 1):243-56. DOI: https://doi.org/10.1111/j.1755-0998.2009.02653.x
Wong EHK, Hanner RH. 2008. DNA barcoding detects market substitution in North American seafood. Food Res Int J 41(8):828-37. DOI: https://doi.org/10.1016/j.foodres.2008.07.005
Yambem T, Samuel VD, Meenakshi VK, Sankar S, Narasimhaiah N. 2017. Intertidal biodiversity of Karnataka coast, south west coast of India. Perspectives on Biodiversity of India Vol. III, 186-92.
Zhang F, Zhao Z. 2004 The influence of neighboring-nucleotide composition on single nucleotide polymorphisms (SNPs) in mouse genome and its comparison with human SNPs. Genomics 84(5):785-95. DOI: https://doi.org/10.1016/j.ygeno.2004.06.015
Copyright (c) 2024 Reni Ambarwati, Fida Rachmadiarti, Herlina Fitrihidajati, Tarzan Purnomo, Rofiza Yolanda, Dwi Anggorowati Rahayu, Ulfi Faizah

This work is licensed under a Creative Commons Attribution-NonCommercial-NoDerivatives 4.0 International License.
Authors who publish with this journal agree with the following terms:
- Authors retain copyright and grant the journal right of first publication, with the work 1 year after publication simultaneously licensed under a Creative Commons attribution-noncommerical-noderivates 4.0 International License that allows others to share, copy and redistribute the work in any medium or format, but only where the use is for non-commercial purposes and an acknowledgement of the work's authorship and initial publication in this journal is mentioned.
- Authors are able to enter into separate, additional contractual arrangements for the non-exclusive distribution of the journal's published version of the work (e.g., post it to an institutional repository or publish it in a book), with an acknowledgement of its initial publication in this journal.
- Authors are permitted and encouraged to post their work online (e.g., in institutional repositories or on their website) prior to and during the submission process, as it can lead to productive exchanges, as well as earlier and greater citation of published work (See The Effect of Open Access).