PREDICTING THE FUTURE DISTRIBUTIONS OF ENDEMIC RATTAN CALAMUS JAVENSIS BLUME UNDER CLIMATE CHANGE SCENARIOS CMIP 5 RCP 8.5 IN 2050 AND 2070 IN WEST JAVA
Predicting the future distributions of endemic rattan

HIGHLIGHTS
Information on how climate change can shape Calamus javensis distributions is still lacking
The study used SDM with RCP 8.5 scenario for the years 2050 and 2070
Suitable habitats for C. javensis are expected to decline by approximately 46.34%
Suitable habitats for C. javensis are expected to be concentrated in western parts of West Java
ABSTRACT
C. javensis is an endemic rattan plant in West Java. While the information on how climate change can shape C. javensis distributions and how C. javensis can cope climate change conditions is still lacking. This information is required considering that C. javensis is an endemic plant in West Java. Then, the purpose of this study is to model the climate change impact on future C. javensis distributions. The study using species distribution modeling (SDM) covering nine locations across West Java with RCP 8.5 climate change scenario for year 2050 and 2070. The result show under the scenarios of climate change, the only appropriate habitats for C. javensis were concentrated in western parts of West Java. Within time series and climate change scenarios, the suitable habitats categorized as very high suitable for C. javensis were estimated to decline. From 2050 to 2070, suitable habitats for C. javensis will decline by around 46.34% from 1025 to 550 km2 in 2070.
INTRODUCTION
In Asia, rattans are the main lianas that live in and spread throughout tropical rainforests. In temperate climates and other tropical and sub-tropical locations, rattans do not grow natively. One of the most significant non-wood forest products used in Asia as a substitute for timber is rattan, which is classified under the Arecaceae/Palmae family and belongs to the Calamoideae subfamily. Climbing plants in the Arecaceae family of palms are commonly referred to as rattan. Rattan is crucial to the community's ability to sustain its livelihood, particularly for the local population that depends on and uses forest resources. In Indonesia, the harvests of rattan are 485.92 tonnes per year with the value of IDR 1,200 per ton (Rinekso et al., 2019). There are currently over 600 rattan species in the world, divided into 13 genera, and almost all of them are utilized by the local population, albeit only approximately 50 of them are valuable commercially (Meitram & Sharma, 2005). Rattan inhabits a wide variety of habitats, including peat swamps, mixed deciduous forests, evergreen and dry evergreen forests, and areas up to 1,000 meters measured from the sea surface (Rozali et al., 2014). Rattans play a vital part in the physiognomy of the tropical rainforest in Indonesia, but the country's most valuable commercial rattan species are already vulnerable because of climate change. According to (Unknown Author, 2024), high climate warming, equal to 3 - 4.5 °C, can lead to mass death of these plant groups.
The most varied genus in the Arecaceae family and among all climbing plant genera is Calamus. The Old World characterized by humid tropics, which include Africa, much of Asia, Australasia, and portions of the Pacific including Fiji, are habitat for Calamus. In southeast Asian dense-canopy forests, where their dominance is a notable feature of Asian liana ecosystems, the genus Calamus achieves its highest level of diversity. An Indonesian rattan species that is indigenous to West Java is Calamus javensis Blume (Arecaceae: Calamoideae) (Mogea, 2004). In actuality, nine of the thirteen genera in the globe are found in Indonesia (Guzman, 2015). According to the numbers of species of each genus, the orders are 15 species for Calamus, 4 species for Daemonorops, 2 species for Korthalsia and Ceratolobus, 1 species for Plectocomia, followed by Retispatha, Plectocomiopsis, Pogonotium, and Myrialepis are the nine genera in discussion. Daemonorops and Calamus were two of those genera that were known to have commercial value. Locally, C. javensis was referred to as rotan lilin by the native populations that used it in its endemic regions.
Large-scale species distribution patterns, mainly those classified as plants and medicinal herbs, have recently been affected by climate change and levels of greenhouse gas (Unknown Author, 2024). The Intergovernmental Panel on Climate Change (IPCC) developed a series of climatic scenarios known as the Representative Concentration Pathways (RCP) following these levels of greenhouse gas. RCP 8.5 is characterized by high fossil fuel consumption, a significant increase in methane emissions, and a slow rate of technological development to mitigate the climate change effects, with no plans to reduce emissions. Therefore, the climate scenario under RCP 8.5 pathway is deemed suitable for modeling the impact of climate change on species distribution, according to (Doulabian et al., 2021).
The current study has emphasized the importance of species dispersion in modeling. As a result, numerous methods have been established to analyze the distribution of species on a geographic scale. One widely used technique is machine learning-based Species Distribution Modeling (SDM), which estimates the potential spatial distribution of various organisms, including crops (Dong et al., 2023)), vegetation (M et al., 2023), animals (Stephenson et al., 2022), and ticks. SDMs employ a variety of methods to assess habitat suitability, including Biomapper, Bioclim, and Domain using a climatic approach, and MaxEnt (Maximum Entropy) using a machine learning approach. Statistical approaches are represented by Generalized Additive Models (GAM) and Generalized Linear Models (GLM). Each machine learning tool has its own unique set of advantages and disadvantages. Following (Marcer et al., 2013), Species Distribution Modeling (SDM) is one of the most popular and effective methods to model habitat suitability. Some of the advantages of SDM, as noted by (Fois et al., 2018), include the capacity to determine the environmental factors having significant contributions, high precision of predictive results, reproducibility, the requirement for only species presence data, and its effectiveness in estimating the potential spatial distribution even with limited data.
C. javensis is an endemic plant in West Java. In addition, C. javensis plays a significant role in supporting local communities and forest conservation by supplying nontimber products (Rahim & Idrus, 2019). While the information on how this species can cope with climate change and how climate change will limit the distribution of certain species is still lacking, this information is required in light of that C. javensis is an endemic plant in West Java. Then, this research sought to simulate the effects of climate change on future C. javensis distributions. The novelty of this study is using SDM and RCP 8.5 to simulate the effects of the most pessimistic climate change scenario.
Figure 1.Nine sampling locations in West Java
MATERIALS AND METHODS
Study Area
The selected area of this study is in West Java Indonesia. West Java is divided into 18 districts and 9 cities Figure 1. Climate in West Java is varied following landscapes. The North and South of West Java were characterized by low land and coastal areas. While the central of West Java is characterized by mountainous areas. The lowest temperature is 9 °C and can reach 34 °C in the coastal regions. In the mountainous areas of West Java, the annual rainfall can range from 3,000 mm to 5,000 mm.
Survey on Calamus javensis
Survey activities were conducted over two months in 2024 at nine sampling locations throughout West Java Figure 1. The sampling sites were chosen based on the presence of natural habitats suitable for C. javensis. To document the presence of C. javensis, we utilized direct visual observation, known as the Visual Encounter Survey (VES), along with a database assembled from literature reviews, including scientific articles and official reports published by government organizations, such as the Indonesian Ministry of Environment and Forestry's agency for agriculture and forestry. VES was employed purposefully by surveying natural habitats including forests and plantations where C. javensis may grow. The surveys were established using ten plots randomly placed in each sampling location throughout West Java. Each plot measured 20 × 20 m, and it was divided into several square subplots. For detailed observation and recording of C. javensis, 20 × 20 m plots for adult rattan level, 10 × 10 m for pole level, 5 × 5 m for sapling level, and 2 × 2 m for rattan seedling level (Joshi et al., 2017). Global Positioning System (GPS) of Garmin Etrex 30 was utilized to retrieve the geocoordinate locations of C. javensis presences in the field. This information was saved in CSV format and then imported into Microsoft Excel for use in Species Distribution Modeling (SDM) habitat suitability analysis. Because presence-only data is widely available, a presence-only SDM was chosen rather than a generalized linear model (GLM). These methods are relatively easy to implement, requiring only the locations where a species has been observed, and can be useful when absence data is limited or unreliable (Leroy, 2022). According to (Jasni & T, 2007), the identification of C. javensis was based on specific identification keys using C. javensis diagnostic features, voucher specimens, and rattan taxonomist confirmation.
| Variables | Sources | Format | Unit |
|---|---|---|---|
| Annual average temperature (Bio 1)* | www.worldclim.org | Data represented in raster format | 0C |
| Mean diurnal range (Bio 2) (mean of monthly (max temp - min temp))* | www.worldclim.org | Data represented in raster format | 0C |
| Isothermality (Bio 3)* | www.worldclim.org | Data represented in raster format | % |
| Seasonality of temperature (Bio 4)* | www.worldclim.org | Data represented in raster format | 0C |
| Warmest month maximum temperature (Bio 5) | www.worldclim.org | Data represented in raster format | 0C |
| Coldest month minimum temperature (Bio 6) | www.worldclim.org | Data represented in raster format | 0C |
| Annual range of temperature (Bio 7)* | www.worldclim.org | Data represented in raster format | 0C |
| Wettest quarter average temperature (Bio 8) | www.worldclim.org | Data represented in raster format | 0C |
| Driest quarter average temperature (Bio 9) | www.worldclim.org | Data represented in raster format | 0C |
| Warmest quarter average temperature (Bio 10) | www.worldclim.org | Data represented in raster format | 0C |
| Coldest quarter average temperature (Bio 11)* | www.worldclim.org | Data represented in raster format | 0C |
| Precipitation per year (Bio 12)* | www.worldclim.org | Data represented in raster format | mm |
| Wettest month rainfall (Bio 13)* | www.worldclim.org | Data represented in raster format | mm |
| Driest month rainfall (Bio 14)* | www.worldclim.org | Data represented in raster format | mm |
| Seasonality of rainfall (Bio 15) | www.worldclim.org | Data represented in raster format | dimensionless |
| Wettest quarter rainfall (Bio 16)* | www.worldclim.org | Data represented in raster format | mm |
| Driest quarter rainfall (Bio 17)* | www.worldclim.org | Data represented in raster format | mm |
| Warmest quarter rainfall (Bio 18)* | www.worldclim.org | Data represented in raster format | mm |
| Coldest quarter rainfall (Bio 19)* | www.worldclim.org | Data represented in raster format | mm |
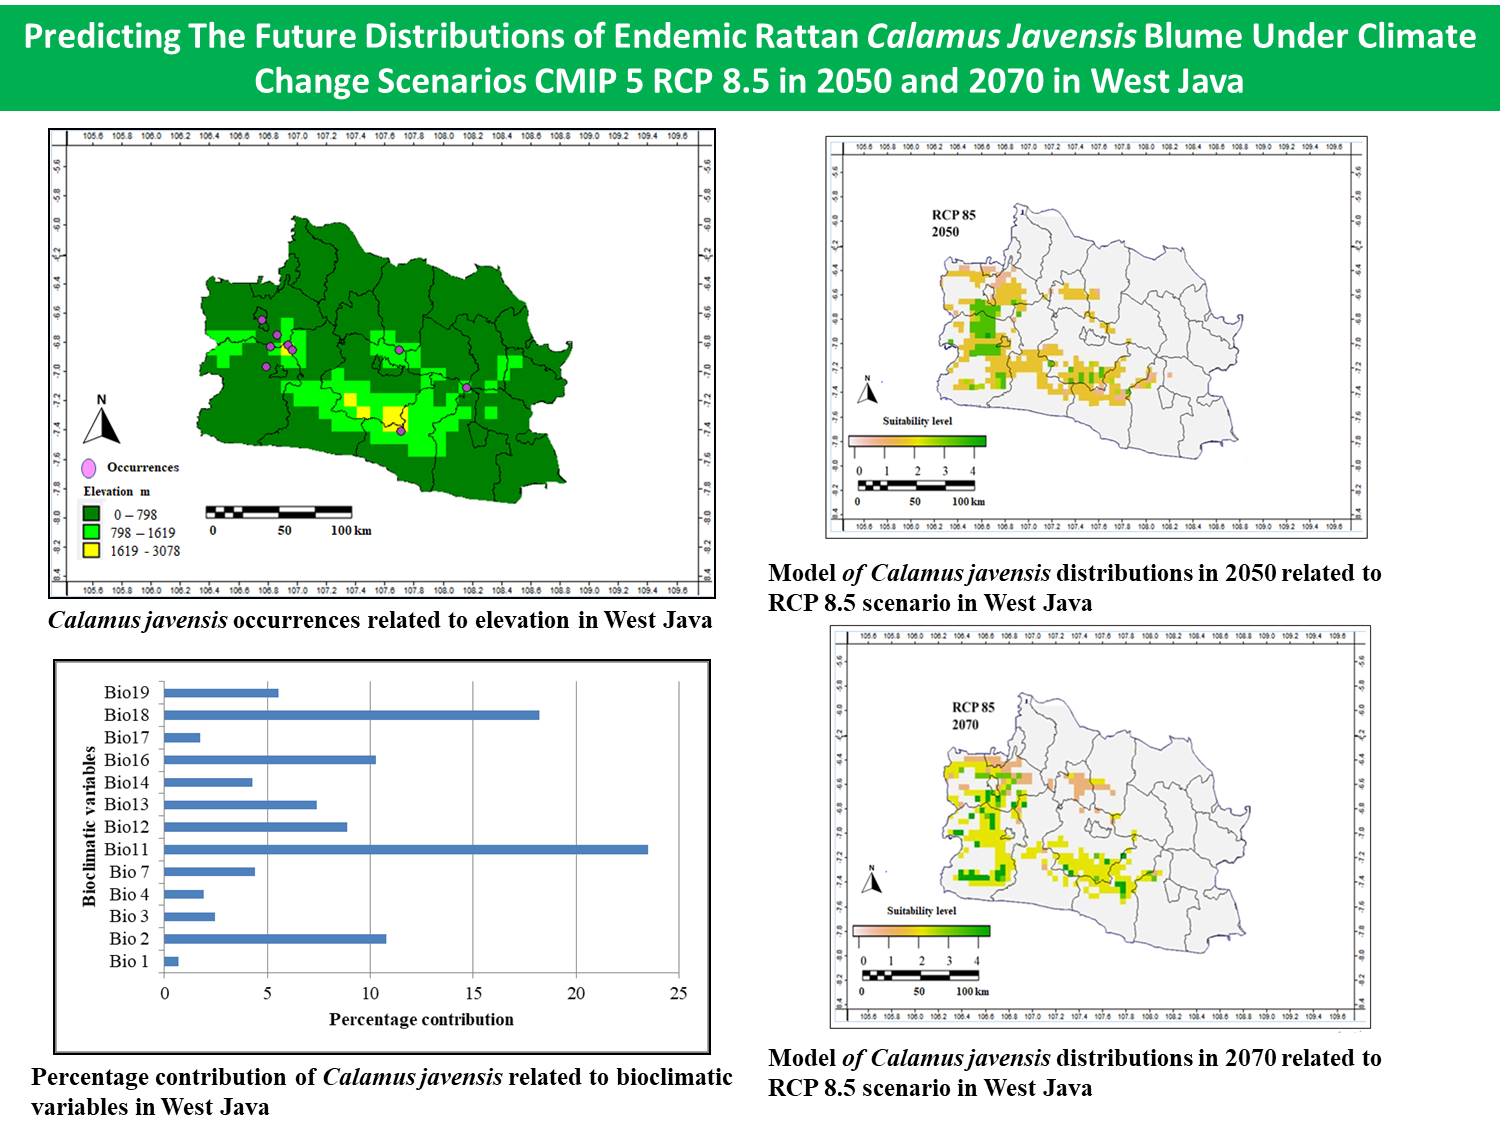
Figure 2.Calamus javensis occurrences related to elevation in West Java
Calamus javensis Bioclimatic Variables
This study examined a range of bioclimatic factors in line with the methods described by (Dong et al., 2023) and (Arshad et al., 2022);Table 1. Particularly in Asia, as highlighted by (Khanum et al., 2013) and (Rana et al., 2017), bioclimatic variables (Bio 1 - Bio 19) from the global climate database WorldClim (www.worldclim.org, version 2.0) (Hijmans et al., 2005) have been widely utilized in modeling the habitat appropriateness at current time. The locality data of West Java was obtained from the WorldClim database by setting the region of interest.
The selection and analysis of environmental factors that significantly impacted the results led to the inclusion of specific bioclimatic variables, aimed at producing an informative and precise model of habitat suitability. A Jackknife analysis was conducted to assess each bioclimatic variable's contribution to the finished model. Several environmental factors identified in the Jackknife analysis were excluded from the model because they had no effect (0% contribution). (Wei et al., 2018) noted that some bioclimatic variables exhibited minimal permutation relevance (less than 6%) or a low average contribution (also less than 6%). Therefore, two critical components for understanding and measuring the importance of bioclimatic variables used in developing the model of species distribution (SDM) are the percentage of contribution and permutation relevance.
Calamus javensis Suitability Analysis
This study utilized species distribution modeling using machine learning approach (SDM) techniques within R application version 3.6.3 to generate estimated suitable maps for C. javensis in West Java and its surrounding areas (Mao et al., 2022). The maps of suitability were created using various R packages, including sp, dismo (Unknown Author, 2022), map tools, rgdal (Bivand, 2022), and raster (Lemenkova, 2020). Nineteen environmental variables (Bio 1 - Bio 19) served as inputs for the SDM. The area under the Receiver Operating Characteristic curve (AUC) was employed to evaluate the model's performance. Additionally, the Jackknife test was conducted to determine each environmental variable's contribution and impact on the habitat suitability model for C. javensis (Promnikorn et al., 2019). The AUC values below 0.5 indicate that the model has performance no better than random or contains vague data, while values above 0.5 suggest that the model is highly effective and precise. The AUC value has a range of 0 - 1, with 0 representing the lowest appropriateness and 1 the highest. Geographic Information Systems (GIS) were utilized to visualize and analyze the maps of prediction generated by the Species Distribution Models (SDM) (Hijmans et al., 2005). Based on (Wei et al., 2018), five levels of habitat suitability can be identified on the SDM model map: 0 signifies unsuited, 1 indicates the suitability is low, 2 denotes the suitability is moderate, 3 represents the suitability is high, and 4 indicates the suitability is very high.
Figure 3.Response curves of Calamus javensis associated with bioclimatic variables in West Java
CMIP 5 Future Scenario
This investigation utilized two scenarios. The first scenario represents the current state in 2023, while the second scenario projects future conditions based on the RCP 8.5 projections from the Fifth Coupled Model Intercomparison Project (CMIP) for the years 2050 and 2070. The future scenario is based on the Intergovernmental Panel on Climate Change's Fifth Assessment Report (AR5) from 2008, which incorporates downscaled data from global climate models in CMIP5. The IPCC's 2014 AR5 report adopted several Representative Concentration Pathways (RCPs) for CMIP5, focusing on variations in levels of greenhouse gas instead of levels of emissions. This new method has replaced the previous projections from the Special Report on Emissions Scenarios (SRES), published in 2000 (Unknown Author, 2009). Based on the expected release of greenhouse gases shortly, these pathways outline four credible future climate scenarios for modeling and research. According to (Unknown Author, 2009), the four Representative Concentration Pathways (RCPs), RCP2.6, RCP4.5, RCP6.0, and RCP8.5, are named according to their projected ranges of radiative forcing values in 2100 relative to pre-industrial levels (+2.6, +4.5, +6.0, and +8.5 W/m², respectively). To forecast the suitable habitat distributions of C. javensis for the years 2050 and 2070, this study employed the RCP8.5 models, which correspond to different climate change scenarios.
RESULTS AND DISCUSSION
Occurrences and Bioclimatic Variables of Calamus javensis
Our study showed a total of nine current occurrences of C. javensis across West Java Figure 2. At the current time, 33.33% of C. javensis occurrences were observed in highland landscapes. Those highland landscapes have elevations with a range of 1,619 - 3,078 m above sea level and are located in Garut and between Sukabumi and Cianjur. While 33.33% of C. javensis occurrences were observed in lowland landscapes at elevations having a range of 0 - 798 m above sea level. Then, in general, the preferred current habitats of C. javensis were dominated by highlands with an elevation range of 798 - 3,078 m above sea level. According to regions, C. javensis was very common in Bogor, Sukabumi and Cianjur in comparison to other regions.
The response curves of Calamus javensis associated with the chosen bioclimatic variables in West Java is presented in Figure 3, while Figure 4 shows numerous bioclimatic variables that have more contributions to the distributions of C. javensis in West Java. Those bioclimatic variables were Bio 11, 18, 2, and 16. Bio 11 which is the coldest quarter average temperature variable indicated that the C. javensis prefers habitats having temperature range from 12.5 oC to 24.0 oC Figure 3. In regard to precipitation, Bio 18 variable indicated that C. javensis prefers habitats which have precipitation of the warmest quarter from 70 mm to 105 mm. Meanwhile, Bio 2 variable indicated that the preferred temperature mean range is 9.0 - 11.5 °C. This narrow range of Bio 2 value is related to the endemism of C. javensis, which can only inhabit limited areas. The Bio 16 variable confirms that the preferred precipitation of the wettest quarter is from 100 mm to 120 mm. High rainfall preferences during the peak of rainy season indicates that the distribution of C. javensis is limited to the mountainous areas where heavy rainfall is common.
Figure 4.Percentage contribution of Calamus javensis related to bioclimatic variables in West Java
In our study, current distributions of C. javensis were widespread, from highlands in mountainous areas to the lowlands around Bogor. This is in agreement with the findings reported in the previous studies. In Cameroon, Calamus resides in elevation with a range of 400 - 1,000 m. In Malaysia, rattan species were recorded ending from an elevation of less than 300 m to 600 m. The rattan species reach high abundance at an elevation of 600 m. In Central Kalimantan, C. javensis was observed residing in the lowlands in the peatland areas (Fambayun & Kalima, 2022). While C. javensis was known to be common in highlands, as reported on Mount Halimun, West Java (Watanabe et al., 2006), (Kalima, 2015) has reported that C. javensis can inhabit areas with an elevation as low as 2 m and as high as 1,200 m above sea level. In West Java, it is widely distributed in the high-elevation areas, including Halimun-Salak and Gede-Pangrango areas. Besides, C. javensis is also recorded in the lowland parks, including in Ujung Kulon. This documented distribution explained the current presence of C. javensis in Sukabumi and Cianjur as parts of the Halimun-Salak and Gede-Pangrango areas. The wide current distribution of C. javensis was related to the seed dispersion that was facilitated by birds and primates allowing wider distributions (Kalima, 2022).
Current and Future Distributions of Calamus javensis
The model of Calamus javensis current distributions in West Java is presented in Figure 5. Based on the estimations, C. javensis was common in the southern regions of West Java, covering Cianjur, Sukabumi, Garut, Bandung, and Bogor Districts. Areas categorized as having very high potential suitability were mostly recorded in Cianjur. Meanwhile, areas classified as high suitability were mostly recorded in Sukabumi and Bandung and small parts in the Bogor bordering Sukabumi and Cianjur.
Figure 5.Model of Calamus javensis current distributions in West Java
Figure 6.Model of Calamus javensis distributions in 2050 (A) and 2070 (B) related to RCP 8.5 scenario in West Java
| Species | Bioclimatic variable | Percentage contribution | Location | Source |
|---|---|---|---|---|
| C. lakshmanae |
Annual precipitation Max temperature of warmest month |
65.4 1.4 |
Western Ghats | (Sreekumar & R.2019, n.d.) |
| C. javensis | The mean temperature of the coldest quarter |
23.49 |
West Java | This study |
| Precipitation of the warmest quarter | 18.19 |
The models of Calamus javensis distributions in West Java under RCP 8.5 climate change scenarios for years 2050 and 2070 are shown in Figure 6. Based on the estimations, it is observed that climate change has impacted the C. javensis distributions. According to the model, climate change has made suitable habitats for C. javensis in Cianjur, Garut, and Bandung disappear. The only remaining suitable habitats would probably be in Sukabumi. Within 20 years, between the year of 2050 and 2070, it is clear that the remaining suitable habitats for C. javensis classified as having very high suitability will be reduced by 46.34% from 1,025 to only 550 km2 in 2070. Also, in 2070, it is predicted that C. javensis would possibly reside in southern parts of Sukabumi. This area is considered a novel area that has never been existed under the current C. javensis distributions. The novelty of these newly predicted areas is that the southern Sukabumi is a lowland and coastal area. Although the current distributions of C. javensis are mostly in highland areas, there is a possibility that this species would occupy coastal areas with low elevation. In South Kalimantan, (Arifin, 2008) observed that C. javensis was common in lowland forests and this supports the possibility of C. javensis to inhabit low coastal areas. In Malaysia, rattans were observed to reach high abundance in the offshore areas.
This study is the first to explore the potential dispersal of C. javensis in specific regions of Southeast Asia. It is comparable to similar habitat suitability studies implemented in other areas, such as (Mehmud et al., 2022) and the Western Ghats in India (Sreekumar & R.2019, n.d.). The findings indicate that temperature and rainfall during the warmest quarter are significant bioclimatic variables affecting the distribution of this species. This aligns with previous research Table 2. (Sreekumar & R.2019, n.d.) noted that the dispersal of Calamus species is primarily affected by several factors, such as latitude, the driest quarter precipitation, total annual rainfall, and the coldest month minimum temperature. Overall, climate plays a more critical role than habitat or human effect in shaping the potential distributions of Calamus species. Most rattan species tend to prefer humid climates, making rainfall a key factor influencing the distribution at the landscape scale of these potential Calamus species.
This study confirmed that the climate change presented in the form of bioclimatic variables change the shape and alter the potential distribution area of the Calamus. Combined with the changes in climatic key variables, ranging from temperature to rainfall and seasonality, ongoing increments and changes in atmospheric greenhouse gases, mostly carbon dioxide (CO₂), influence and affect the growth and physiology of plants, including Calamus. Mainly in the tropics, increasing levels of CO2 have the potential to increase the growing season leaf area. In addition, elevated CO2 levels are associated with increased water use efficiency, increased photosynthesis rate, and increased root and stem growth of Calamus. It seems likely that elevated CO2 have a positive effect on the growth, development, and physiology of Calamus. This explained the presence of Calamus in the area that had never been recorded before, as reported in this study. While not all palm species benefit from the climate change effects, Buttler and (Butler & Larson, 2020) recorded that only one out of four species of palms are benefitted due to climate change. Others are remained stable and other are slightly increase. This condition is relevant to the condition and explains that the Calamus in this study has various reactions to the climate change effects.
Calamus is a plant that belongs to the Arecaceae family. The climate change influence on the dispersal and presence of species in the Arecaceae group, or palms, has been validated by earlier reports. Palms have been used as markers for the previous paleoclimate linked to the megathermal because of their sensitivity (Butler & Larson, 2020). For palm species, temperature combined with palm dispersal capacity regulates palm presence. Since the beginning of the Quaternary period in the western hemisphere, palms have been observed to exist and disappear, which also contributes to extinction. It is thought that the existence of climate oscillations is what caused these historical occurrences, which occurred about 2.6 million years ago.
Important details regarding Calamus management, cultivation, and conservation, primarily in West Java, are provided by the anticipated appropriate habitat for Calamus in the future. Commercial Calamus cultivations can be established and applied using the results. It has been noted that the Calamus continues to live in its current habitat and maintain its natural range. Calamus is spreading to the new habitat areas at the same time. This study suggests creating and maintaining natural corridors in conjunction with large-scale forestry-protected areas. In addition to this strategy, the establishment of germplasm banks is advised in order to manage and preserve these significant endemic rattan species mainly in West Java regions.
This study has succeeded in using 13 bioclimatic variables as the determinant factors that have effects on the dispersals of this certain species. In the future, the approach to the appropriate distribution of rattan is recommended to be developed by incorporating more determinant variables, including environmental variables and rattan seed dispersal facilitated by winds, birds and primates.
CONCLUSION
At the present time, it is estimated that C. javensis is widely distributed in the southern parts of West Java, with areas expanding from Garut in the east, Bandung in the central, and Cianjur and Sukabumi in the west. The climate change scenario with emissions of 8.5 W/m2 is projected to reduce the current suitable habitats for C. javensis so that the only suitable habitats for C. javensis would be concentrated in Sukabumi. Within the time series and climate change scenarios, the potential habitats categorized as highly suitable for C. javensis are estimated to decline by around 46.34%, from 1,025 to only 550 km2 in 2070.
References
- Arifin Y.F.. Inventory and habitat distribution of rattans on upland and lowland forest in South Kalimantan. Biota. 2008; 13(3):141-46.
- Arshad F., Waheed M., Fatima K., Harun N., Iqbal M., Fatima K., Umbreen S.. Predicting the suitable current and future potential distribution of the native endangered tree Tecomella undulata (Sm. Seem. in Pakistan. Sustainability. 2022; 14(7215)DOI
- As’ary M., Setiawan Y., Rinaldi D.. Analysis of changes in habitat suitability of the Javan Leopard, 2000-2020. Diversity. 2023; 15(529)DOI
- Butler C.J., Larson M.. Climate change winners and losers: The effects of climate change on five palm species in the Southeastern United States. Ecol Evol. 2020; 10(19):10408-425.
- Bivand R.R.. Geogr Anal 54. 2022. DOI
- Dong H., Zhang N., Shen S., Zhu S., Fan S., Lu Y.. Effects of climate change on the spatial distribution of the threatened species Rhododendron purdomii in Qinling-Daba mountains of Central China: implications for conservation. Sustainability. 2023; 15(4)DOI
- Doulabian S., Golian S., Toosi A.S., Murphy C.. Evaluating the effects of climate change on precipitation and temperature for Iran using RCP scenarios. J Water Clim Chang. 2021; 12(1):166-84. DOI
- Fambayun R.A., Kalima T.. Rattan: Its role for food-alternative of the community near the peatland areas in Central Kalimantan. IOP Conference Series. Earth and Environmental Science. 2022; 959(1)DOI
- Fois M., Cuena-Lombraña A., Fenu G., Bacchetta G.. Using species distribution models at a local scale to guide poorly known species, review: Methodological issues and future directions. Ecol Model. 2018; 385:124-32. DOI
- Guzman M.J.. Species diversity of rattan (UAY) in selected municipalities in the province of Abra, Philippines. JPAIR Multidiscip Res. 2015; 20(1):35-54. DOI
- Hijmans R.J., Cameron S.E., Parra J.L., Jones P.G., Jarvis A.. Very high resolution interpolated climate surfaces for global land areas. Int J Climatol. 2005; 25:1965-78. DOI
- Climate Change I.P.C.C.] Intergovernmental Panel. Towards new scenarios for analysis of emissions, climate change, impacts, and response strategies. Environ Policy Collect. 2008; 5(5):399-406.
- Jasni Damayanti R., T Kalima. Atlas Rotan Indonesia Jilid I. Indonesian Rattan Atlas. 2007; I
- Joshi M., Charles B., Ravikanth G., Aravind N.. Assigning conservation value and identifying hotspots of endemic rattan diversity in the Western Ghats, India. Plant Divy. 2017; 39(5):263-72. DOI
- Kalima T.. Pros Sem Nas Masy Biodiv Indon 1:1802-09. 2015. DOI
- Kalima T.. Seminar Nasional Pendidikan Biologi dan Saintek (SNPBS. 2022. Publisher Full Text
- Maxent modelling and impact of climate change on habitat suitability variations of economically important Chilgoza Pine (Pinus gerardiana wall.) in South Asia. Forests. 2022; 13(5)DOI
- Khanum R., Mumtaz A., Kumar S.. Predicting impacts of climate change on medicinal Asclepiads of Pakistan using Maxent modeling. Acta Oecol. 2013; 49(23-31)
- Lemenkova P.. Using R packages 'Tmap', 'Raster' And 'Ggmap' for cartographic visualization: An example of DEM-based terrain modelling of Italy, Apennine Peninsula. Zbornik radova. 2020; 68:99-116. DOI
- Leroy B.. Choosing presence‐only species distribution models. J Biogeogr. 2022; 50(1):247-50. DOI
- Mao M., Chen S., Qian Z., Xu Y.. Maxent to predict the potential distribution of the little fire ant (Wasmannia auropunctata) in China. Insects. 2022; 13(1008)DOI
- Marcer A., Sáe L., Molowny-Horas R., Pons X., Pino J.. Using species distribution modelling to disentangle realised versus potential distributions for rare species conservation. Biol Cons. 2013; 166:221-30. DOI
- Mehmud S., Kalita N., Roy H., Sahariah D.. Species distribution modelling of Calamus floribundus Griff. Arecaceae) using Maxent in Assam. Acta Ecol Sin. 2022; 42(2):115-21. DOI
- Meitram N., Sharma N.. Rattan resources of Manipur: Species diversity and reproductive biology of elite species. J Bamboo Rattan. 2005; 4(4):399-419. DOI
- Mogea J.P.. Palem Di Taman Nasional Gunung Halimun [Palm trees in Mount Halimun National Park. Berita Biologi. 2004; 7(1):95-105.
- Préau C., Trochet A., Bertrand R., Isselin-Nondedeu F.. Modeling potential distributions of three European amphibian species comparing ENFA and Maxent. Herpetological Conservation. 2018; 13(1):91-104.
- Promnikorn K., Jutamanee K., Kraichak E.. MaxEnt model for predicting potential distribution of Vitex glabrata R.Br. in Thailand. Agr Nat Resour. 2019; 53:44-8.
- Rahim W.R.W.A., Idrus R.M.. Importance and uses of forest product bamboo and rattan: their value to socioeconomics of local communities. Int J Acad Res Bus Soc Sci. 2019; 8(12):1484-97. DOI
- Rana S.K., Rana H.K., Ghimire S.K., Shrestha K.K., Ranjitkar S.. Predicting the impact of climate change on the distribution of two threatened Himalayan medicinal plants of liliaceae in Nepal. J Mt Sci. 2017; 14(3):558-70. DOI
- Rinekso N., Yulianto N., Hikmat A., Kusmana C.. Silviculture and productivity of Calamus inops as an important resource toward self-financing for Lore Lindu National Park. IOP Conference Series Earth and Environmental Science. 2019; 394(1)DOI
- Rozali W.N.F.Z., Mazum K.M., Zakaria R., Mansor A., Othman A.S.. Species diversity and abundance of rattan in offshore hillreserve forest of peninsular Malaysia along the elevation gradient. J Bamboo Rattan. 2014; 13(1&2):1-11.
- M Sánchez Pérez, TP Feria Arroyo, CS Venegas Barrera, C Sosa-Gutiérrez, J Torres, KA Brown, G Gordillo Pérez. Predicting the impact of climate change on the distribution of Rhipicephalus sanguineus in the Americas. Sustainability. 2023; 15(4557)DOI
- Sreekumar V.B., R.2019 Sasi. Predicting the geographical distribution of Calamus lakshmanae Renuka (Arecaceae), an endemic rattan in the Western Ghats, India. J Bamboo Rattan. 18(2):24-30.
- Stephenson K., Wilson B., Taylor M., Mclaren K., Veen R., Kunna J., Campbell J.. Modelling climate change impacts on tropical dry forest fauna. Sustainability. 2022; 14(8)DOI
- The representative concentration pathways: An overview. Clim Change. 2009; 109:5-31. DOI
- Watanabe N.M., Miyamoto J., Suzuki E.. Growth strategy of the stoloniferous rattan Calamus javensis in Mt. Halimun, Java. Ecol Res. 2006; 21:238-45. DOI
- Wei B., Wang R., Hou K., Wang X., Wu W.. Predicting the current and future cultivation regions of Carthamus tinctorius using Maxent model under climate change in China. Global Ecol Conserv. 2018; 16DOI
- IPCC Secretariat: Geneva (CH; 2009.
- Effects of climate warming on soil nitrogen cycles and bamboo growth in core giant panda habitat. Sci Total Environ. 2024; 944(173625)DOI
As’ary M, Setiawan Y, Rinaldi, D. 2023. Analysis of changes in habitat suitability of the Javan Leopard, 2000–2020. Diversity 15(529). DOI: 10.3390/d15040529 DOI: https://doi.org/10.3390/d15040529
Arifin YF. 2008. Inventory and Habitat Distribution of rattans on upland and lowland forest in South Kalimantan. Biota 13(3):141-146.
Arshad F, Waheed M, Fatima K, Harun N, Iqbal M, Fatima K, Umbreen S. 2022. Predicting the suitable current and future potential distribution of the native endangered tree Tecomella undulata (Sm.) Seem. in Pakistan. Sustainability 14: 7215. DOI: 10.3390/su14127215 DOI: https://doi.org/10.3390/su14127215
Butler CJ, Larson M. 2020. Climate change winners and losers: The effects of climate change on five palm species in the Southeastern United States. Ecology and Evolution 10(19): 10408-10425. DOI: https://doi.org/10.1002/ece3.6697
Bivand RR. 2022. Packages for analyzing spatial data: a comparative case study with areal data. Geographical Analysis 54. DOI: 10.1111/gean.12319 DOI: https://doi.org/10.1111/gean.12319
Dong H, Zhang N, Shen S, Zhu S, Fan S, Lu Y. 2023, Effects of climate change on the spatial distribution of the threatened species Rhododendron purdomii in Qinling-Daba mountains of Central China: implications for conservation. Sustainability 15(4): 3181. DOI: 10.3390/su15043181 DOI: https://doi.org/10.3390/su15043181
Doulabian S, Golian S, Toosi AS, Murphy C. 2021. Evaluating the effects of climate change on precipitation and temperature for Iran using RCP scenarios. Journal of Water and Climate Change 12(1):166–184. DOI: 10.2166/wcc.2020.114 DOI: https://doi.org/10.2166/wcc.2020.114
Fambayun RA, Kalima T. 2022. Rattan: its role for food-alternative of the community near the peatland areas in Central Kalimantan. IOP Conference Series. Earth and Environmental Science 959(1): 012062. DOI: 10.1088/1755-1315/959/1/012062 DOI: https://doi.org/10.1088/1755-1315/959/1/012062
Fois M, Cuena-Lombraña A, Fenu G, Bacchetta, G. 2018. Using species distribution models at a local scale to guide poorly known species, review: methodological issues and future directions. Ecol Model 385:124–132. DOI: 10.1016/j.ecolmodel.2018.07.018 DOI: https://doi.org/10.1016/j.ecolmodel.2018.07.018
Hijmans RJ, Cameron SE, Parra JL, Jones PG, Jarvis A. 2005. Very high resolution interpolated climate surfaces for global land areas. Int J Climatol 25:1965-1978. DOI: 10.1002/joc.1276 DOI: https://doi.org/10.1002/joc.1276
IPOC 2008. Towards new scenarios for analysis of emissions, climate change, impacts, and response strategies. Environ Policy Collect 5(5):399–406.
Jasni, Damayanti R, Kalima T. 2007. Atlas Rotan Indonesia Jilid I [Indonesian Rattan Atlas Volume I]. Bogor (ID): Pusat Penelitian dan Pengembangan Hasil Hutan Kalima, T. 2015. Keanekaragaman spesies rotan di Jawa Barat dan prospek pengembangan [Diversity of rattan species in West Java and development prospects]. Pros Sem Nas Masy Biodiv Indon 1:1802-1809. DOI: 10.13057/psnmbi/m010809 DOI: https://doi.org/10.13057/psnmbi/m010809
Kalima T. 2022. Identifikasi dan klasifikasi spesies rotan di Indonesia [Identification and classification of rattan species in Indonesia]. Seminar Nasional Pendidikan Biologi dan Saintek (SNPBS) ke-VII:33-40.
Khan AM, Li Q, Saqib Z, Khan N, Habib T, Khalid N, Majeed M. Tariq A. 2022. Maxent modelling and impact of climate change on habitat suitability variations of economically important Chilgoza Pine (Pinus gerardiana wall.) in South Asia. Forests DOI: 13:715. 10.3390/f13050715 DOI: https://doi.org/10.3390/f13050715
Khanum R, Mumtaz A, Kumar, S. 2013. Predicting impacts of climate change on medicinal asclepiads of Pakistan using Maxent modeling. Acta Oecologica 49:23-31. DOI: 10.1016/j.actao.2013.02.007 DOI: https://doi.org/10.1016/j.actao.2013.02.007
Lemenkova P. 2020. Using R packages 'Tmap', 'Raster' And 'Ggmap' for cartographic visualization: an example of DEM-based terrain modelling of Italy, Apennine Peninsula. Zbornik radova - Geografski fakultet Univerziteta u Beograd. 68:99–116.DOI: 10.5937/zrgfub2068099L DOI: https://doi.org/10.5937/zrgfub2068099L
Mao M, Chen S, Qian Z, Xu, Y. 2022.Using Maxent to predict the potential distribution of the little fire ant (Wasmannia auropunctata) in China. Insects 13: 1008. DOI: 10.3390/insects13111008 DOI: https://doi.org/10.3390/insects13111008
Marcer A, Sáe L, Molowny-Horas R, Pons X, Pino J. 2013. Using species distribution modelling to disentangle realised versus potential distributions for rare species conservation. Biol Cons 166:221–230. DOI: 10.1016/j.biocon.2013.07.001 DOI: https://doi.org/10.1016/j.biocon.2013.07.001
Mehmud S, Kalita N, Roy H, Sahariah D. 2022. Species distribution modelling of Calamus floribundus Griff. (Arecaceae) using Maxent in Assam. Acta Ecologica Sinica 42(2):115-121. DOI: 10.1016/j.chnaes.2021.10.005. DOI: https://doi.org/10.1016/j.chnaes.2021.10.005
Mogea JP. 2004. Palem Di Taman Nasional Gunung Halimun [Palm trees in Mount Halimun National Park]. Berita Biologi 7(1).
Préau C, Trochet A, Bertrand R, Isselin-Nondedeu F. 2018. Modeling potential distributions of three European amphibian species comparing ENFA and Maxent. Herpetological Conservation 13(1).
Promnikorn K, Jutamanee K, Kraichak E. 2019. MaxEnt model for predicting potential distribution of Vitex glabrata R.Br. in Thailand. Agr Nat Resour 53:44–48.
Rana SK, Rana HK, Ghimire SK, Shrestha KK, Ranjitkar S. 2017. Predicting the impact of climate change on the distribution of two threatened Himalayan medicinal plants of liliaceae in Nepal. J Mt Sci 14(3):558-570. DOI: 10.1007/s11629-015-3822-1 DOI: https://doi.org/10.1007/s11629-015-3822-1
Rozali WNFZ, Mazum KM, Zakaria R, Mansor A, Othman AS. 2014. Species diversity and abundance of rattan in offshore hillreserve forest of peninsular Malaysia along the elevation gradient. J. Bamboo and Rattan 13(1):1-11.
Sánchez Pérez M, Feria Arroyo TP, Venegas Barrera CS, Sosa-Gutiérrez C, Torres J, Brown KA, Gordillo Pérez G. 2023. Predicting the impact of climate change on the distribution of Rhipicephalus sanguineus in the Americas. Sustainability 15:4557. DOI: 10.3390/su15054557 DOI: https://doi.org/10.3390/su15054557
Sreekumar VB, Sasi R.2019. Predicting the geographical distribution of Calamus lakshmanae Renuka (Arecaceae), an endemic rattan in the Western Ghats, India. J Bamboo and Rattan, 18(2):24 – 30
Stephenson K, Wilson B, Taylor M, Mclaren K, Veen R, Kunna J, Campbell J. 2022. Modelling climate change impacts on tropical dry forest fauna. Sustainability 14(8). DOI: /10.3390/su14084760 DOI: https://doi.org/10.3390/su14084760
Vuuren DPV, Edmonds J, Kainuma M, Kainuma M, Riahi K, Thomson A, Hibbard K, Hurtt GC, Kram T, Krey V, Lamarque JF, Masui T, Meinshausen M, Nakicenovic N, Smith SJ, Rose SK. 2009. The representative concentration pathways: an overview. Clim Change 109:5–31. DOI: 10.1007/s10584-011-0148-z DOI: https://doi.org/10.1007/s10584-011-0148-z
Watanabe NM, Miyamoto J, Suzuki E. 2006. Growth strategy of the stoloniferous rattan Calamus javensis in Mt. Halimun, Java. Ecol Res 21:238–245. DOI: 10.1007/s11284-005-0109-y DOI: https://doi.org/10.1007/s11284-005-0109-y
Wei B, Wang R, Hou K, Wang X, Wu W. 2018. Predicting the current and future cultivation regions of Carthamus tinctorius using Maxent model under climate change in China. Global Ecology and Conservation 16: E00477. DOI: 10.1016/j.gecco.2018.e00477 DOI: https://doi.org/10.1016/j.gecco.2018.e00477
Weyant J, Azar C, Kainuma M, Kejun J, Nakicenovic N, Shukla PR, La Rovere E, Yohe G. 2009. Report of 2.6 Versus 2.9 Watts/m2 RCPP evaluation panel. Geneva: IPCC Secretariat.
Copyright (c) 2025 Andri Wibowo

This work is licensed under a Creative Commons Attribution-NonCommercial-NoDerivatives 4.0 International License.
Authors who publish with this journal agree with the following terms:
- Authors retain copyright and grant the journal right of first publication, with the work 1 year after publication simultaneously licensed under a Creative Commons attribution-noncommerical-noderivates 4.0 International License that allows others to share, copy and redistribute the work in any medium or format, but only where the use is for non-commercial purposes and an acknowledgement of the work's authorship and initial publication in this journal is mentioned.
- Authors are able to enter into separate, additional contractual arrangements for the non-exclusive distribution of the journal's published version of the work (e.g., post it to an institutional repository or publish it in a book), with an acknowledgement of its initial publication in this journal.
- Authors are permitted and encouraged to post their work online (e.g., in institutional repositories or on their website) prior to and during the submission process, as it can lead to productive exchanges, as well as earlier and greater citation of published work (See The Effect of Open Access).